


Logarithmic axes with pgfplots
Replace axis with semilogyaxis (log y), semilogxaxis (log x) or loglogaxis (both), or set ymode=log or xmode=log on a normal axis.
A log scale on the y axis
Values that grow by factors, such as counts, errors or frequencies, read best on a log scale. semilogyaxis keeps x linear and makes y logarithmic. Ticks sit at the powers of ten and are labelled as $10^k$.
Exponential growth on a log y axis
\begin{tikzpicture}
  \begin{semilogyaxis}[xlabel={Day}, ylabel={Cells}, grid=major]
    \addplot coordinates {(0,44) (1,120) (2,350) (3,980) (4,2700) (5,7600) (6,21000)};
  \end{semilogyaxis}
\end{tikzpicture}
A straight line on this plot means constant growth by the same factor per step.
Both axes logarithmic
loglogaxis makes both axes logarithmic. A power law such as $y = x^2$ becomes a straight line whose slope is the exponent.
Power laws on a log-log plot
\begin{tikzpicture}
  \begin{loglogaxis}[xlabel=$n$, ylabel={Time (s)}, legend pos=north west]
    \addplot coordinates {(10,0.001) (100,0.01) (1000,0.1) (10000,1)};
    \addplot coordinates {(10,0.0001) (100,0.01) (1000,1) (10000,100)};
    \legend{$O(n)$, $O(n^2)$}
  \end{loglogaxis}
\end{tikzpicture}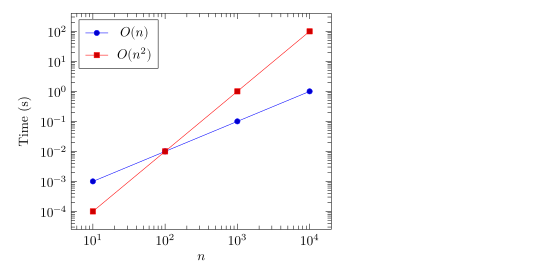
The same with xmode and ymode
xmode=log and ymode=log give a normal axis a log scale. This is handy when the choice is made by a style, or inside a group plot.
xmode=log on a normal axis
\begin{tikzpicture}
  \begin{axis}[xmode=log, xlabel={Frequency (Hz)}, ylabel={Gain (dB)}, ymin=-30, ymax=5]
    \addplot[blue, thick, domain=1:5, samples=60, variable=t]
      ({10^t}, {-10*log10(1 + (10^t/1000)^2)});
  \end{axis}
\end{tikzpicture}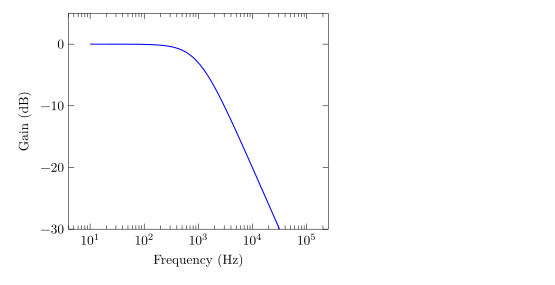
Formulas work on log axes too, but domain and samples are in data units: the samples are spread evenly between the two ends, so on a log axis almost all of them land in the last decade. The example therefore plots a parametric curve in the exponent t, from $10^1$ to $10^5$, which spreads the samples evenly along the log axis. pgfplots behaves the same way.
Another base
log basis y=2 (or log basis x) changes the base. Ticks then sit at the powers of 2 and are labelled $2^k$.
Base 2 on the y axis
\begin{tikzpicture}
  \begin{semilogyaxis}[log basis y=2, xlabel={Doublings}, ymin=1, ymax=64]
    \addplot coordinates {(0,1) (1,2) (2,4) (3,8) (4,16) (5,32)};
  \end{semilogyaxis}
\end{tikzpicture}
Options on log axes
| Option | In Scissor LaTeX | Notes |
|---|---|---|
semilogxaxis, semilogyaxis, loglogaxis | Works | |
xmode=log, ymode=log | Works | |
log basis x=b, log basis y=b | Works | |
ymin, ymax on a log axis | Works | Give positive values. |
log ticks with fixed point | Not supported | Ignored with a message; labels stay as powers. |
ybar stacked on a log axis | Not supported | The bars are drawn over each other, not stacked, and no message is shown. |
| values of 0 or below | Dropped | Points that cannot be shown on a log scale are left out, with one message. |
What differs from a TeX installation
See bar charts for bars on linear axes and the pgfplots manual for every option: ctan.org/pkg/pgfplots.
See also Line plots, Group plots and Contours and heat maps.
Questions and answers
How do I make the y axis logarithmic in pgfplots?
Use \begin{semilogyaxis} ... \end{semilogyaxis} instead of axis, or add ymode=log to the axis options.
Why does my log plot show no data?
A log axis cannot show zero or negative values. Points with such values are dropped, and the Problems tab says so. Shift the data or use a linear axis.
Can I use base 2 or base e?
Yes, with log basis y=2 (or any positive number, for example log basis x=2.71828).
Every example on this page is typeset by Scissor LaTeX when the site is built. Last updated 2026-11-06.