


Scatter plots with pgfplots
Add only marks to an \addplot in a pgfplots axis, so the points are drawn without lines; choose the shape with mark= and read the points from coordinates or a table.
Points without lines
A scatter plot is a series drawn with marks only. Add only marks to the \addplot, with + to keep the cycle list's colour and mark.
Two groups of points
\begin{tikzpicture}
  \begin{axis}[xlabel={Height (m)}, ylabel={Mass (kg)}, legend pos=north west]
    \addplot+[only marks] coordinates {
      (1.62,55) (1.68,61) (1.71,66) (1.75,69) (1.80,74) (1.84,79)};
    \addplot+[only marks] coordinates {
      (1.58,49) (1.64,57) (1.69,58) (1.73,64) (1.77,68)};
    \legend{Group A, Group B}
  \end{axis}
\end{tikzpicture}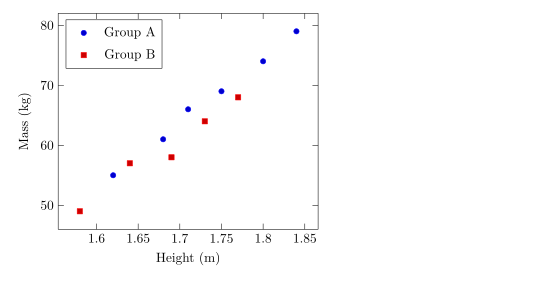
Mark shapes, sizes and colours
mark= sets the shape and mark size= its radius (2pt by default). Filled shapes end in *. mark options styles only the marks, for example an open mark with a white fill.
Different marks for different series
\begin{tikzpicture}
  \begin{axis}[enlargelimits=0.15, legend pos=outer north east]
    \addplot[only marks, mark=o, blue] coordinates {(1,2) (2,3) (3,2.5)};
    \addplot[only marks, mark=square*, red, mark size=3pt] coordinates {(1,1) (2,1.8) (3,1.2)};
    \addplot[only marks, mark=triangle*, teal, mark options={fill=white}] coordinates {(1,3) (2,4) (3,3.8)};
    \addplot[only marks, mark=x, black, mark size=4pt] coordinates {(1.5,0.5) (2.5,0.8)};
    \legend{circle, square, triangle, cross}
  \end{axis}
\end{tikzpicture}
The shapes that work are listed on the line plots page.
Points from a table
For more than a handful of points, write them as a table. The first row names the columns; x= and y= pick the columns to plot. The table can sit inline, as here, or in a file (see data from a CSV file).
Points read from an inline table
\begin{tikzpicture}
  \begin{axis}[xlabel={Hours studied}, ylabel={Points}]
    \addplot[only marks, mark=*, blue!70!black] table[x=hours, y=points] {
      hours points
      2     21
      3     26
      4     30
      5     29
      6     37
      7     40
      8     44
    };
    \addplot[red, domain=2:8] {13.5 + 3.8*x};
  \end{axis}
\end{tikzpicture}
The red line is a formula drawn over the points, a simple way to show a fitted trend.
Colouring points by a value
With scatter, each point is coloured from the colour map by a value. point meta=y uses the y value; scatter src=explicit with meta= reads a third column. Add colorbar to show the scale.
Points coloured by a third column
\begin{tikzpicture}
  \begin{axis}[colorbar, colormap/viridis, xlabel=$x$, ylabel=$y$]
    \addplot[scatter, only marks, mark size=3pt, scatter src=explicit]
      table[x=x, y=y, meta=t] {
      x   y   t
      0.5 1.0 10
      1.0 2.2 15
      1.6 1.4 21
      2.1 3.0 28
      2.8 2.1 33
      3.3 3.6 44
    };
  \end{axis}
\end{tikzpicture}
Classes of points
In pgfplots, scatter/classes gives each class name in a column its own mark. Scissor LaTeX does not support it yet: the option is ignored with a message, and every point gets the same mark.
scatter/classes: one mark for all points
\begin{tikzpicture}
  \begin{axis}[width=6cm, height=5cm]
    \addplot[scatter, only marks, scatter src=explicit symbolic,
             scatter/classes={a={mark=square*, blue}, b={mark=*, red}}]
      table[meta=group] {
      x y group
      1 1 a
      2 2 b
      3 1.5 a
    };
  \end{axis}
\end{tikzpicture}
Problems tab: pgfplots option 'scatter/classes' is not supported yet
What differs from a TeX installation
Full details of marks and scatter options are in the pgfplots manual: ctan.org/pkg/pgfplots.
Questions and answers
How do I make a scatter plot without lines?
Add only marks to the \addplot options, for example \addplot+[only marks] coordinates {...};.
How do I change the size of the points?
Use mark size=3pt on the \addplot. The value is the radius of the mark.
Can I plot points from a CSV file?
Yes. Upload the file to the project and write \addplot+[only marks] table[x=a, y=b, col sep=comma] {file.csv};.
Every example on this page is typeset by Scissor LaTeX when the site is built. Last updated 2026-11-06.