


Plotting data from a CSV file
Add the file to your project and write \addplot table[x=col1, y=col2, col sep=comma] {file.csv}; inside a pgfplots axis.
Plot two columns of a file
Upload the CSV file to your project (or create it there). The first line names the columns. x= and y= choose them by name, and col sep=comma says that commas separate the values.
This page uses a small file, data-from-csv-weather.csv:
month,temp,rain,sd
1,1.2,44,0.8
2,2.0,38,0.7
3,5.6,41,0.9
...
12,2.3,46,0.8
Temperature per month from a CSV file
\begin{tikzpicture}
  \begin{axis}[xlabel={Month}, ylabel={Temperature ($^\circ$C)}, xtick={1,...,12}]
    \addplot table[x=month, y=temp, col sep=comma] {data-from-csv-weather.csv};
  \end{axis}
\end{tikzpicture}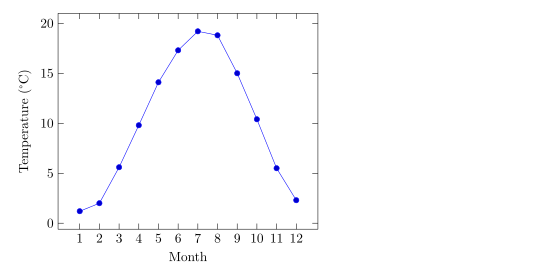
Files in a folder work too: write the path as in the project, for example {data/weather.csv}.
Several columns, error columns and computed values
Read the same file once per series. y error= takes error bars from a column, and y expr= computes a value from the row, with \thisrow{name} for a column.
Two series from one file
\begin{tikzpicture}
  \begin{axis}[xlabel={Month}, ylabel={Value}, legend pos=north west, ymin=0]
    \addplot+[error bars/.cd, y dir=both, y explicit]
      table[x=month, y=temp, y error=sd, col sep=comma] {data-from-csv-weather.csv};
    \addplot+[mark=none, dashed]
      table[x=month, y expr=\thisrow{rain}/2, col sep=comma] {data-from-csv-weather.csv};
    \legend{Temperature ($^\circ$C), Rain / 2 (mm)}
  \end{axis}
\end{tikzpicture}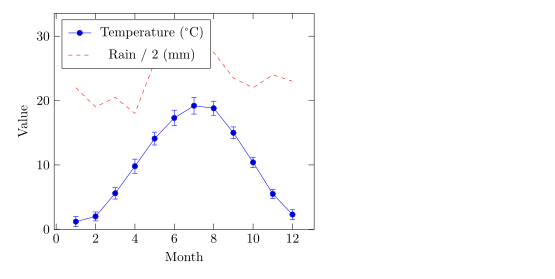
Reading a table once
\pgfplotstableread reads a file into a macro, which every \addplot can then use. It is shorter when the same table feeds several plots.
\pgfplotstableread and two plots
\pgfplotstableread[col sep=comma]{data-from-csv-weather.csv}\weather
\begin{tikzpicture}
  \begin{axis}[ybar, bar width=6pt, ymin=0, xlabel={Month}, ylabel={Rain (mm)},
               xtick={1,...,12}, enlarge x limits=0.06]
    \addplot table[x=month, y=rain] {\weather};
  \end{axis}
\end{tikzpicture}
Data inside the document: filecontents
Small data sets can live in the .tex file itself. filecontents* writes its content as a file of that name, which \addplot table then reads. The file is in the preamble, before \begin{document}.
Data written with filecontents*
\documentclass{article}
\usepackage{pgfplots}
\begin{filecontents*}{speed.dat}
t   v
0   0
1   4.4
2   8.1
3   11.0
4   13.2
\end{filecontents*}
\begin{document}
\begin{tikzpicture}
  \begin{axis}[xlabel={Time (s)}, ylabel={Speed (m/s)}]
    \addplot table[x=t, y=v] {speed.dat};
  \end{axis}
\end{tikzpicture}
\end{document}
Here the columns are separated by spaces, the pgfplots default, so col sep is not needed.
Table options
| Option | What it does | In Scissor LaTeX |
|---|---|---|
x=name, y=name | columns by name | Works |
x index=0, y index=1 | columns by number, from 0 | Works |
col sep=comma | also space, tab, semicolon, & | Works |
header=false | the first line is data, not names | Works |
skip first n=2 | ignore the first lines | Works |
x expr=, y expr= | compute a value, with \thisrow{name}, \thisrowno{n} or \coordindex | Works |
y error=, x error= | error bar columns | Works |
comment chars=! | more comment characters (# and % lines are always skipped) | Works |
\pgfplotstableread | read a table into a macro | Works |
\pgfplotstabletypeset | print a table as a LaTeX table | Not supported: skipped with a message |
Empty cells, nan and inf are treated as missing values and left out.
When something goes wrong
If a .csv file is read without col sep=comma, Scissor LaTeX still finds the commas, so the plot is drawn, but the Problems tab asks you to add the option. A TeX installation would not guess, and the plot would fail there.
Missing col sep: drawn, with a reminder
\begin{tikzpicture}
  \begin{axis}[width=6cm, height=4.5cm]
    \addplot table[x=month, y=temp] {data-from-csv-weather.csv};
  \end{axis}
\end{tikzpicture}
Problems tab: Add col sep=comma to read data-from-csv-weather.csv so it also works in LaTeX
A file that is not in the project leaves that plot out. The axis is still drawn, and the Problems tab names the missing file.
A missing file
\begin{tikzpicture}
  \begin{axis}[width=6cm, height=4.5cm]
    \addplot table[col sep=comma] {results.csv};
  \end{axis}
\end{tikzpicture}
Problems tab: Data file not in the project: results.csv
What differs from a TeX installation
Everything here is pgfplots syntax, so the files compile in a TeX installation too. Manual: ctan.org/pkg/pgfplots. For error bars from columns, see error bars.
Questions and answers
How do I plot a CSV file in LaTeX?
Put the file in the project and write \addplot table[x=a, y=b, col sep=comma] {file.csv}; in an axis, with your column names for a and b.
My CSV uses semicolons. What do I write?
Use col sep=semicolon. For tabs, use col sep=tab.
Can I plot a column against the row number?
Yes: table[x expr=\coordindex, y=name] uses 0, 1, 2 and so on as x values.
Every example on this page is typeset by Scissor LaTeX when the site is built. Last updated 2026-11-06.