


Bar charts with pgfplots
Add ybar (vertical bars) or xbar (horizontal bars) to a pgfplots axis, name the categories with symbolic x coords, and give each series as an \addplot with coordinates.
Vertical bars with named categories
ybar on the axis turns every series into bars. symbolic x coords lists the category names in order, and xtick=data puts one tick under each bar.
One series of bars
\begin{tikzpicture}
  \begin{axis}[
      ybar, ymin=0,
      symbolic x coords={Mon, Tue, Wed, Thu, Fri},
      xtick=data,
      ylabel={Visitors},
      enlarge x limits=0.15,
    ]
    \addplot coordinates {(Mon,44) (Tue,31) (Wed,38) (Thu,27) (Fri,40)};
  \end{axis}
\end{tikzpicture}
Bars start at zero. Without ymin=0 the axis adds a little room below zero, so set it to make the bars stand on the frame. enlarge x limits adds room at the sides, so the outer bars are not cut by the frame.
Grouped bars and value labels
With several series, the bars of each category stand side by side. nodes near coords prints each value above its bar, and bar width sets the width (10pt by default).
Two series, with values on the bars
\begin{tikzpicture}
  \begin{axis}[
      ybar, ymin=0, ymax=55, bar width=12pt,
      symbolic x coords={Erika, Hans, John},
      xtick=data, enlarge x limits=0.25,
      nodes near coords,
      ylabel={Points},
      legend style={at={(0.5,-0.12)}, anchor=north, legend columns=2},
    ]
    \addplot coordinates {(Erika,44) (Hans,31) (John,38)};
    \addplot coordinates {(Erika,40) (Hans,36) (John,29)};
    \legend{Round 1, Round 2}
  \end{axis}
\end{tikzpicture}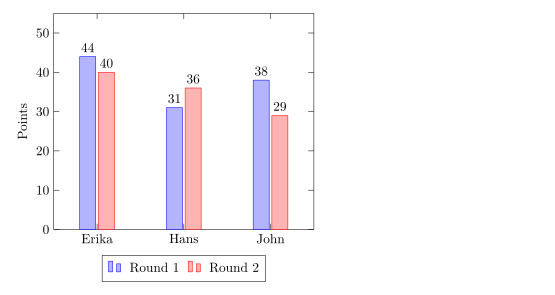
ybar=4pt sets the gap between the bars of a group (2pt by default).
Stacked bars
ybar stacked puts the series on top of each other instead of side by side. The second \addplot starts where the first ends.
Stacked bars per quarter
\begin{tikzpicture}
  \begin{axis}[
      ybar stacked, ymin=0, bar width=16pt,
      symbolic x coords={Q1, Q2, Q3, Q4},
      xtick=data, enlarge x limits=0.2,
      legend pos=north west, ylabel={Sales},
    ]
    \addplot coordinates {(Q1,12) (Q2,18) (Q3,15) (Q4,22)};
    \addplot coordinates {(Q1,6) (Q2,9) (Q3,12) (Q4,10)};
    \legend{Online, In store}
  \end{axis}
\end{tikzpicture}
Horizontal bars
xbar draws the bars from left to right. Swap the roles of the axes: the categories go in symbolic y coords and ytick=data, and each coordinate is written as (value, category).
Horizontal bars
\begin{tikzpicture}
  \begin{axis}[
      xbar, xmin=0, xmax=50,
      symbolic y coords={Rust, Python, C},
      ytick=data, enlarge y limits=0.3,
      nodes near coords, xlabel={Projects},
      width=8cm, height=5cm,
    ]
    \addplot coordinates {(44,Rust) (31,Python) (12,C)};
  \end{axis}
\end{tikzpicture}
xbar stacked works too.
Numbers as categories
Years and other numbers do not need symbolic x coords: plot them as numbers and use xtick=data. pgfplots writes 2024 as "2,024" by default; turn the thousands separator off in the tick label style.
Years on the x axis
\begin{tikzpicture}
  \begin{axis}[
      ybar, ymin=0, xtick=data, enlarge x limits=0.25,
      x tick label style={/pgf/number format/1000 sep=},
    ]
    \addplot coordinates {(2023,18) (2024,31) (2025,44)};
  \end{axis}
\end{tikzpicture}Options at a glance
| Option | What it does | In Scissor LaTeX |
|---|---|---|
ybar, xbar | vertical or horizontal bars, side by side | Works |
ybar=4pt | the gap between bars of one group | Works |
ybar stacked, xbar stacked | bars on top of each other | Works on linear axes |
bar width=12pt | the width of each bar | Works |
bar shift=.. | move a series sideways | Works |
nodes near coords | the value above (or beside) each bar | Works |
symbolic x coords, symbolic y coords | named categories | Works, except names that look like numbers (no tick labels) |
xticklabel style={rotate=45, anchor=east} | slanted category names | Works |
ybar interval | bars that fill the space between x values | Partly: drawn as ordinary bars at the x values |
hist (statistics library) | count values into bins | Not supported: ignored with a message, the raw values are drawn as a line |
What differs from a TeX installation
All examples on this page also compile with pgfplots in a TeX installation. Manual: ctan.org/pkg/pgfplots.
See also pgfplots basics, Error bars, Data from CSV and pgfplots.
Questions and answers
How do I make a bar chart in LaTeX?
Load pgfplots and write \begin{axis}[ybar, symbolic x coords={A,B,C}, xtick=data] with one \addplot coordinates {(A,3) (B,5) (C,2)}; per series.
How do I show the values on top of the bars?
Add nodes near coords to the axis options. Each bar gets its value as a label.
How do I make the bars start at zero?
They already start at zero. Set ymin=0 on the axis (or xmin=0 for xbar) to remove the space below them.
Every example on this page is typeset by Scissor LaTeX when the site is built. Last updated 2026-11-06.