


แผนภาพการกระจายด้วย pgfplots
เพิ่ม only marks ให้ \addplot ใน axis ของ pgfplots เพื่อให้วาดจุดโดยไม่มีเส้น เลือกรูปร่างด้วย mark= และอ่านจุดจากพิกัดหรือตาราง
จุดที่ไม่มีเส้น
แผนภาพการกระจายคือข้อมูลชุดที่วาดด้วยเครื่องหมายจุดเท่านั้น เพิ่ม only marks ให้ \addplot พร้อม + เพื่อคงสีและเครื่องหมายจุดจาก cycle list ไว้
จุดสองกลุ่ม
\begin{tikzpicture}
  \begin{axis}[xlabel={Height (m)}, ylabel={Mass (kg)}, legend pos=north west]
    \addplot+[only marks] coordinates {
      (1.62,55) (1.68,61) (1.71,66) (1.75,69) (1.80,74) (1.84,79)};
    \addplot+[only marks] coordinates {
      (1.58,49) (1.64,57) (1.69,58) (1.73,64) (1.77,68)};
    \legend{Group A, Group B}
  \end{axis}
\end{tikzpicture}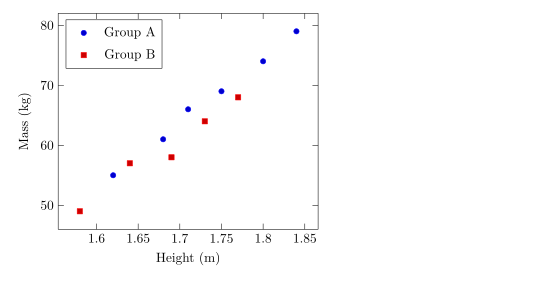
รูปร่าง ขนาด และสีของเครื่องหมายจุด
mark= กำหนดรูปร่าง และ mark size= กำหนดรัศมี (ค่าเริ่มต้น 2pt) รูปร่างแบบทึบลงท้ายด้วย * ส่วน mark options กำหนดสไตล์เฉพาะเครื่องหมายจุด เช่น เครื่องหมายแบบโปร่งที่เติมสีขาว
เครื่องหมายจุดต่างกันสำหรับข้อมูลแต่ละชุด
\begin{tikzpicture}
  \begin{axis}[enlargelimits=0.15, legend pos=outer north east]
    \addplot[only marks, mark=o, blue] coordinates {(1,2) (2,3) (3,2.5)};
    \addplot[only marks, mark=square*, red, mark size=3pt] coordinates {(1,1) (2,1.8) (3,1.2)};
    \addplot[only marks, mark=triangle*, teal, mark options={fill=white}] coordinates {(1,3) (2,4) (3,3.8)};
    \addplot[only marks, mark=x, black, mark size=4pt] coordinates {(1.5,0.5) (2.5,0.8)};
    \legend{circle, square, triangle, cross}
  \end{axis}
\end{tikzpicture}รูปร่างที่ใช้ได้แสดงอยู่ในหน้ากราฟเส้น
จุดจากตาราง
หากมีจุดมากกว่าไม่กี่จุด ให้เขียนเป็นตาราง แถวแรกคือชื่อคอลัมน์ และ x= กับ y= เลือกคอลัมน์ที่จะวาด ตารางจะเขียนไว้ในโค้ดโดยตรงอย่างในตัวอย่างนี้ หรืออยู่ในไฟล์ก็ได้ (ดูข้อมูลจากไฟล์ CSV)
จุดที่อ่านจากตารางในโค้ด
\begin{tikzpicture}
  \begin{axis}[xlabel={Hours studied}, ylabel={Points}]
    \addplot[only marks, mark=*, blue!70!black] table[x=hours, y=points] {
      hours points
      2     21
      3     26
      4     30
      5     29
      6     37
      7     40
      8     44
    };
    \addplot[red, domain=2:8] {13.5 + 3.8*x};
  \end{axis}
\end{tikzpicture}
เส้นสีแดงคือสูตรที่วาดทับจุดต่าง ๆ ซึ่งเป็นวิธีง่าย ๆ ในการแสดงแนวโน้มที่ปรับให้เข้ากับข้อมูล
การระบายสีจุดตามค่า
เมื่อใช้ scatter แต่ละจุดจะได้สีจากแผนที่สีตามค่าหนึ่ง point meta=y ใช้ค่า y ส่วน scatter src=explicit ร่วมกับ meta= จะอ่านคอลัมน์ที่สาม เพิ่ม colorbar เพื่อแสดงมาตราส่วน
จุดที่ระบายสีตามคอลัมน์ที่สาม
\begin{tikzpicture}
  \begin{axis}[colorbar, colormap/viridis, xlabel=$x$, ylabel=$y$]
    \addplot[scatter, only marks, mark size=3pt, scatter src=explicit]
      table[x=x, y=y, meta=t] {
      x   y   t
      0.5 1.0 10
      1.0 2.2 15
      1.6 1.4 21
      2.1 3.0 28
      2.8 2.1 33
      3.3 3.6 44
    };
  \end{axis}
\end{tikzpicture}
กลุ่มของจุด
ใน pgfplots scatter/classes จะให้เครื่องหมายจุดเฉพาะแก่ชื่อกลุ่มแต่ละชื่อในคอลัมน์ Scissor LaTeX ยังไม่รองรับ ตัวเลือกนี้จะถูกละเว้นพร้อมข้อความแจ้ง และทุกจุดจะได้เครื่องหมายเดียวกัน
scatter/classes: เครื่องหมายเดียวสำหรับทุกจุด
\begin{tikzpicture}
  \begin{axis}[width=6cm, height=5cm]
    \addplot[scatter, only marks, scatter src=explicit symbolic,
             scatter/classes={a={mark=square*, blue}, b={mark=*, red}}]
      table[meta=group] {
      x y group
      1 1 a
      2 2 b
      3 1.5 a
    };
  \end{axis}
\end{tikzpicture}
แท็บปัญหา: pgfplots option 'scatter/classes' is not supported yet
สิ่งที่ต่างจากการติดตั้ง TeX
รายละเอียดทั้งหมดของเครื่องหมายจุดและตัวเลือก scatter อยู่ในคู่มือ pgfplots: ctan.org/pkg/pgfplots
คำถามและคำตอบ
จะสร้างแผนภาพการกระจายโดยไม่มีเส้นได้อย่างไร
เพิ่ม only marks ในตัวเลือกของ \addplot เช่น \addplot+[only marks] coordinates {...};
จะเปลี่ยนขนาดของจุดได้อย่างไร
ใช้ mark size=3pt ที่ \addplot ค่านี้คือรัศมีของเครื่องหมายจุด
วาดจุดจากไฟล์ CSV ได้ไหม
ได้ อัปโหลดไฟล์เข้าโปรเจกต์แล้วเขียน \addplot+[only marks] table[x=a, y=b, col sep=comma] {file.csv};
ทุกตัวอย่างในหน้านี้จัดหน้าโดย Scissor LaTeX ขณะสร้างเว็บไซต์ อัปเดตล่าสุด 2026-11-07