


pgfplots ने स्कॅटर प्लॉट
pgfplots च्या axis मधील \addplot ला only marks जोडा, म्हणजे पॉइंट्स रेषांशिवाय काढले जातात; mark= ने आकार निवडा आणि पॉइंट्स निर्देशांकांमधून किंवा टेबलमधून वाचा.
रेषांशिवाय पॉइंट्स
स्कॅटर प्लॉट म्हणजे फक्त मार्क्सनी काढलेली मालिका. cycle list चा रंग आणि मार्क ठेवण्यासाठी + सह \addplot ला only marks जोडा.
पॉइंट्सचे दोन गट
\begin{tikzpicture}
  \begin{axis}[xlabel={Height (m)}, ylabel={Mass (kg)}, legend pos=north west]
    \addplot+[only marks] coordinates {
      (1.62,55) (1.68,61) (1.71,66) (1.75,69) (1.80,74) (1.84,79)};
    \addplot+[only marks] coordinates {
      (1.58,49) (1.64,57) (1.69,58) (1.73,64) (1.77,68)};
    \legend{Group A, Group B}
  \end{axis}
\end{tikzpicture}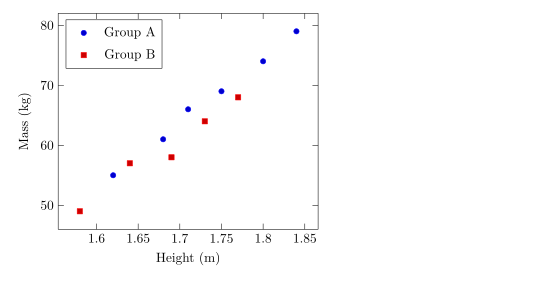
मार्क्सचे आकार, आकारमान आणि रंग
mark= आकार ठरवतो आणि mark size= त्याची त्रिज्या (डीफॉल्ट 2pt). भरलेल्या आकारांच्या शेवटी * असतो. mark options फक्त मार्क्सना शैली देतो, उदाहरणार्थ पांढऱ्या भरणासह पोकळ मार्क.
वेगवेगळ्या मालिकांसाठी वेगवेगळे मार्क्स
\begin{tikzpicture}
  \begin{axis}[enlargelimits=0.15, legend pos=outer north east]
    \addplot[only marks, mark=o, blue] coordinates {(1,2) (2,3) (3,2.5)};
    \addplot[only marks, mark=square*, red, mark size=3pt] coordinates {(1,1) (2,1.8) (3,1.2)};
    \addplot[only marks, mark=triangle*, teal, mark options={fill=white}] coordinates {(1,3) (2,4) (3,3.8)};
    \addplot[only marks, mark=x, black, mark size=4pt] coordinates {(1.5,0.5) (2.5,0.8)};
    \legend{circle, square, triangle, cross}
  \end{axis}
\end{tikzpicture}
चालणाऱ्या आकारांची यादी लाइन प्लॉट पेजवर आहे.
टेबलमधील पॉइंट्स
काही मोजक्या पॉइंट्सपेक्षा जास्त असल्यास, ते टेबल म्हणून लिहा. पहिली रांग कॉलम्सना नावे देते; x= आणि y= प्लॉट करायचे कॉलम्स निवडतात. टेबल इथे आहे तसे इनलाइन असू शकते, किंवा फाइलमध्ये (पाहा CSV फाइलमधील डेटा).
इनलाइन टेबलमधून वाचलेले पॉइंट्स
\begin{tikzpicture}
  \begin{axis}[xlabel={Hours studied}, ylabel={Points}]
    \addplot[only marks, mark=*, blue!70!black] table[x=hours, y=points] {
      hours points
      2     21
      3     26
      4     30
      5     29
      6     37
      7     40
      8     44
    };
    \addplot[red, domain=2:8] {13.5 + 3.8*x};
  \end{axis}
\end{tikzpicture}
लाल रेषा म्हणजे पॉइंट्सवर काढलेले सूत्र, फिट केलेला कल दाखवण्याचा एक सोपा मार्ग.
मूल्यानुसार पॉइंट्स रंगवणे
scatter सह प्रत्येक पॉइंट एका मूल्यानुसार कलर मॅपमधून रंगवला जातो. point meta=y y मूल्य वापरतो; meta= सह scatter src=explicit तिसरा कॉलम वाचतो. स्केल दाखवण्यासाठी colorbar जोडा.
तिसऱ्या कॉलमनुसार रंगवलेले पॉइंट्स
\begin{tikzpicture}
  \begin{axis}[colorbar, colormap/viridis, xlabel=$x$, ylabel=$y$]
    \addplot[scatter, only marks, mark size=3pt, scatter src=explicit]
      table[x=x, y=y, meta=t] {
      x   y   t
      0.5 1.0 10
      1.0 2.2 15
      1.6 1.4 21
      2.1 3.0 28
      2.8 2.1 33
      3.3 3.6 44
    };
  \end{axis}
\end{tikzpicture}
पॉइंट्सचे वर्ग
pgfplots मध्ये scatter/classes कॉलममधील प्रत्येक वर्गाच्या नावाला स्वतःचा मार्क देतो. Scissor LaTeX ला अजून त्याचे समर्थन नाही: पर्याय संदेशासह दुर्लक्षित केला जातो, आणि प्रत्येक पॉइंटला तोच मार्क मिळतो.
scatter/classes: सर्व पॉइंट्ससाठी एकच मार्क
\begin{tikzpicture}
  \begin{axis}[width=6cm, height=5cm]
    \addplot[scatter, only marks, scatter src=explicit symbolic,
             scatter/classes={a={mark=square*, blue}, b={mark=*, red}}]
      table[meta=group] {
      x y group
      1 1 a
      2 2 b
      3 1.5 a
    };
  \end{axis}
\end{tikzpicture}
समस्या टॅब: pgfplots option 'scatter/classes' is not supported yet
TeX इन्स्टॉलेशनपेक्षा काय वेगळे आहे
मार्क्स आणि scatter पर्यायांचे संपूर्ण तपशील pgfplots पुस्तिकेत आहेत: ctan.org/pkg/pgfplots.
प्रश्न आणि उत्तरे
रेषांशिवाय स्कॅटर प्लॉट कसा बनवायचा?
\addplot च्या पर्यायांमध्ये only marks जोडा, उदाहरणार्थ \addplot+[only marks] coordinates {...};.
पॉइंट्सचा आकार कसा बदलायचा?
\addplot वर mark size=3pt वापरा. मूल्य म्हणजे मार्कची त्रिज्या.
मी CSV फाइलमधील पॉइंट्स प्लॉट करू शकतो का?
हो. फाइल प्रोजेक्टमध्ये अपलोड करा आणि \addplot+[only marks] table[x=a, y=b, col sep=comma] {file.csv}; लिहा.
या पेजवरील प्रत्येक उदाहरण साइट तयार होताना Scissor LaTeX टाइपसेट करते. शेवटचे अपडेट: 2026-11-07.