


用 pgfplots 绘制散点图
在 pgfplots 的 axis 中给 \addplot 加上 only marks,这样点就不会用线连接;用 mark= 选择形状,并从坐标或表格中读取点。
不带线的点
散点图是只用标记绘制的系列。在 \addplot 上加 only marks,并加 + 以保留循环列表的颜色和标记。
两组点
\begin{tikzpicture}
  \begin{axis}[xlabel={Height (m)}, ylabel={Mass (kg)}, legend pos=north west]
    \addplot+[only marks] coordinates {
      (1.62,55) (1.68,61) (1.71,66) (1.75,69) (1.80,74) (1.84,79)};
    \addplot+[only marks] coordinates {
      (1.58,49) (1.64,57) (1.69,58) (1.73,64) (1.77,68)};
    \legend{Group A, Group B}
  \end{axis}
\end{tikzpicture}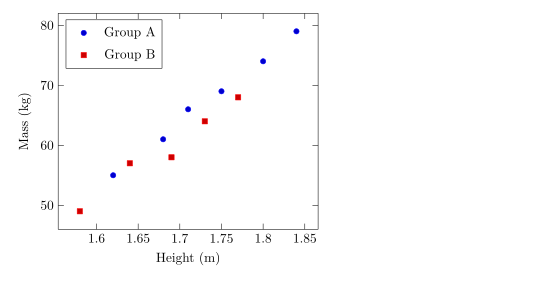
标记的形状、大小和颜色
mark= 设置形状,mark size= 设置半径(默认 2pt)。以 * 结尾的是填充形状。mark options 只设置标记的样式,例如白色填充的空心标记。
不同系列使用不同标记
\begin{tikzpicture}
  \begin{axis}[enlargelimits=0.15, legend pos=outer north east]
    \addplot[only marks, mark=o, blue] coordinates {(1,2) (2,3) (3,2.5)};
    \addplot[only marks, mark=square*, red, mark size=3pt] coordinates {(1,1) (2,1.8) (3,1.2)};
    \addplot[only marks, mark=triangle*, teal, mark options={fill=white}] coordinates {(1,3) (2,4) (3,3.8)};
    \addplot[only marks, mark=x, black, mark size=4pt] coordinates {(1.5,0.5) (2.5,0.8)};
    \legend{circle, square, triangle, cross}
  \end{axis}
\end{tikzpicture}可用的形状列在折线图页面上。
来自表格的点
点比较多时,可以把它们写成表格。第一行是列名;x= 和 y= 选择要绘制的列。表格可以像这里一样直接写在代码中,也可以放在文件里(请参阅来自 CSV 文件的数据)。
从内联表格读取的点
\begin{tikzpicture}
  \begin{axis}[xlabel={Hours studied}, ylabel={Points}]
    \addplot[only marks, mark=*, blue!70!black] table[x=hours, y=points] {
      hours points
      2     21
      3     26
      4     30
      5     29
      6     37
      7     40
      8     44
    };
    \addplot[red, domain=2:8] {13.5 + 3.8*x};
  \end{axis}
\end{tikzpicture}
红线是画在点上的一个公式,这是展示拟合趋势的简单方法。
按数值给点着色
使用 scatter 时,每个点会按某个数值从颜色映射中取色。point meta=y 使用 y 值;scatter src=explicit 配合 meta= 读取第三列。加上 colorbar 可以显示色标。
按第三列着色的点
\begin{tikzpicture}
  \begin{axis}[colorbar, colormap/viridis, xlabel=$x$, ylabel=$y$]
    \addplot[scatter, only marks, mark size=3pt, scatter src=explicit]
      table[x=x, y=y, meta=t] {
      x   y   t
      0.5 1.0 10
      1.0 2.2 15
      1.6 1.4 21
      2.1 3.0 28
      2.8 2.1 33
      3.3 3.6 44
    };
  \end{axis}
\end{tikzpicture}
点的分类
在 pgfplots 中,scatter/classes 会给某一列中的每个类别名称分配各自的标记。Scissor LaTeX 暂不支持:该选项会被忽略并给出提示,所有点都使用同一种标记。
scatter/classes:所有点使用同一种标记
\begin{tikzpicture}
  \begin{axis}[width=6cm, height=5cm]
    \addplot[scatter, only marks, scatter src=explicit symbolic,
             scatter/classes={a={mark=square*, blue}, b={mark=*, red}}]
      table[meta=group] {
      x y group
      1 1 a
      2 2 b
      3 1.5 a
    };
  \end{axis}
\end{tikzpicture}
“问题”标签页: pgfplots option 'scatter/classes' is not supported yet
与 TeX 发行版的不同之处
标记和散点选项的完整说明见 pgfplots 手册:ctan.org/pkg/pgfplots。
常见问题
如何绘制不带线的散点图?
在 \addplot 的选项中加 only marks,例如 \addplot+[only marks] coordinates {...};。
如何更改点的大小?
在 \addplot 上使用 mark size=3pt。该值是标记的半径。
可以绘制 CSV 文件中的点吗?
可以。把文件上传到项目中,然后写 \addplot+[only marks] table[x=a, y=b, col sep=comma] {file.csv};。
本页的每个示例都在构建网站时由 Scissor LaTeX 排版。 最后更新:2026-11-07