


pgfplots से स्कैटर प्लॉट
pgfplots axis में किसी \addplot में only marks जोड़ें, ताकि पॉइंट बिना लाइनों के ड्रॉ हों; mark= से आकार चुनें और पॉइंट कोऑर्डिनेट या टेबल से पढ़ें।
बिना लाइनों के पॉइंट
स्कैटर प्लॉट एक ऐसी सीरीज़ है जो सिर्फ़ मार्क से ड्रॉ होती है। \addplot में only marks जोड़ें, और साइकिल लिस्ट का रंग और मार्क रखने के लिए + लगाएँ।
पॉइंट के दो समूह
\begin{tikzpicture}
  \begin{axis}[xlabel={Height (m)}, ylabel={Mass (kg)}, legend pos=north west]
    \addplot+[only marks] coordinates {
      (1.62,55) (1.68,61) (1.71,66) (1.75,69) (1.80,74) (1.84,79)};
    \addplot+[only marks] coordinates {
      (1.58,49) (1.64,57) (1.69,58) (1.73,64) (1.77,68)};
    \legend{Group A, Group B}
  \end{axis}
\end{tikzpicture}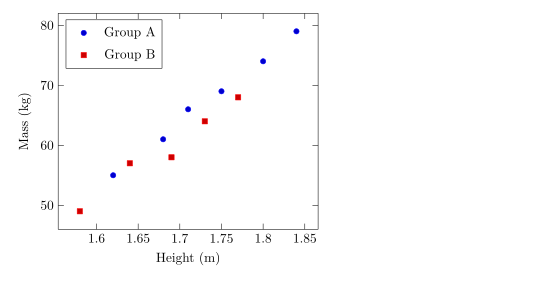
मार्क के आकार, साइज़ और रंग
mark= आकार तय करता है और mark size= उसकी त्रिज्या (डिफ़ॉल्ट 2pt)। भरे हुए आकार * पर खत्म होते हैं। mark options सिर्फ़ मार्क को स्टाइल देता है, जैसे सफ़ेद फ़िल वाला खुला मार्क।
अलग सीरीज़ के लिए अलग मार्क
\begin{tikzpicture}
  \begin{axis}[enlargelimits=0.15, legend pos=outer north east]
    \addplot[only marks, mark=o, blue] coordinates {(1,2) (2,3) (3,2.5)};
    \addplot[only marks, mark=square*, red, mark size=3pt] coordinates {(1,1) (2,1.8) (3,1.2)};
    \addplot[only marks, mark=triangle*, teal, mark options={fill=white}] coordinates {(1,3) (2,4) (3,3.8)};
    \addplot[only marks, mark=x, black, mark size=4pt] coordinates {(1.5,0.5) (2.5,0.8)};
    \legend{circle, square, triangle, cross}
  \end{axis}
\end{tikzpicture}
काम करने वाले आकारों की लिस्ट लाइन प्लॉट पेज पर है।
टेबल से पॉइंट
कुछ से ज़्यादा पॉइंट हों तो उन्हें टेबल के रूप में लिखें। पहली पंक्ति कॉलम के नाम बताती है; x= और y= प्लॉट करने वाले कॉलम चुनते हैं। टेबल यहाँ की तरह इनलाइन हो सकती है, या किसी फ़ाइल में (देखें CSV फ़ाइल से डेटा)।
इनलाइन टेबल से पढ़े गए पॉइंट
\begin{tikzpicture}
  \begin{axis}[xlabel={Hours studied}, ylabel={Points}]
    \addplot[only marks, mark=*, blue!70!black] table[x=hours, y=points] {
      hours points
      2     21
      3     26
      4     30
      5     29
      6     37
      7     40
      8     44
    };
    \addplot[red, domain=2:8] {13.5 + 3.8*x};
  \end{axis}
\end{tikzpicture}
लाल लाइन पॉइंट के ऊपर ड्रॉ किया गया एक फ़ॉर्मूला है, फ़िट किया गया ट्रेंड दिखाने का एक आसान तरीका।
वैल्यू के हिसाब से पॉइंट रंगना
scatter के साथ हर पॉइंट को किसी वैल्यू के हिसाब से कलर मैप से रंग मिलता है। point meta=y y वैल्यू इस्तेमाल करता है; meta= के साथ scatter src=explicit एक तीसरा कॉलम पढ़ता है। स्केल दिखाने के लिए colorbar जोड़ें।
तीसरे कॉलम के हिसाब से रंगे पॉइंट
\begin{tikzpicture}
  \begin{axis}[colorbar, colormap/viridis, xlabel=$x$, ylabel=$y$]
    \addplot[scatter, only marks, mark size=3pt, scatter src=explicit]
      table[x=x, y=y, meta=t] {
      x   y   t
      0.5 1.0 10
      1.0 2.2 15
      1.6 1.4 21
      2.1 3.0 28
      2.8 2.1 33
      3.3 3.6 44
    };
  \end{axis}
\end{tikzpicture}
पॉइंट की क्लास
pgfplots में scatter/classes किसी कॉलम के हर क्लास नाम को उसका अपना मार्क देता है। Scissor LaTeX अभी इसे सपोर्ट नहीं करता: ऑप्शन मैसेज के साथ अनदेखा किया जाता है, और हर पॉइंट को एक ही मार्क मिलता है।
scatter/classes: सभी पॉइंट के लिए एक मार्क
\begin{tikzpicture}
  \begin{axis}[width=6cm, height=5cm]
    \addplot[scatter, only marks, scatter src=explicit symbolic,
             scatter/classes={a={mark=square*, blue}, b={mark=*, red}}]
      table[meta=group] {
      x y group
      1 1 a
      2 2 b
      3 1.5 a
    };
  \end{axis}
\end{tikzpicture}
समस्याएँ टैब: pgfplots option 'scatter/classes' is not supported yet
TeX इंस्टॉलेशन से क्या अलग है
मार्क और scatter ऑप्शन की पूरी जानकारी pgfplots मैनुअल में है: ctan.org/pkg/pgfplots।
सवाल और जवाब
बिना लाइनों का स्कैटर प्लॉट कैसे बनाएँ?
\addplot के ऑप्शन में only marks जोड़ें, जैसे \addplot+[only marks] coordinates {...};।
पॉइंट का साइज़ कैसे बदलें?
\addplot पर mark size=3pt इस्तेमाल करें। वैल्यू मार्क की त्रिज्या है।
क्या मैं CSV फ़ाइल से पॉइंट प्लॉट कर सकता हूँ?
हाँ। फ़ाइल को प्रोजेक्ट में अपलोड करें और \addplot+[only marks] table[x=a, y=b, col sep=comma] {file.csv}; लिखें।
इस पेज का हर उदाहरण साइट बनते समय Scissor LaTeX टाइपसेट करता है। पिछला अपडेट: 2026-11-07।