


pgfplots로 산점도 그리기
pgfplots axis 안의 \addplot에 only marks를 넣어 점을 선 없이 그리세요. 모양은 mark=로 고르고, 점은 좌표나 표에서 읽습니다.
선 없는 점
산점도는 마커만으로 그린 계열입니다. \addplot에 only marks를 넣고, 순환 목록의 색과 마커를 유지하려면 +를 붙이세요.
두 그룹의 점
\begin{tikzpicture}
  \begin{axis}[xlabel={Height (m)}, ylabel={Mass (kg)}, legend pos=north west]
    \addplot+[only marks] coordinates {
      (1.62,55) (1.68,61) (1.71,66) (1.75,69) (1.80,74) (1.84,79)};
    \addplot+[only marks] coordinates {
      (1.58,49) (1.64,57) (1.69,58) (1.73,64) (1.77,68)};
    \legend{Group A, Group B}
  \end{axis}
\end{tikzpicture}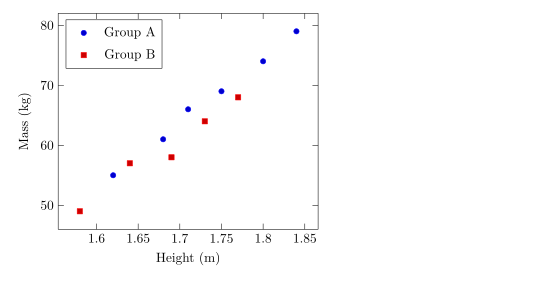
마커 모양, 크기, 색
mark=는 모양을, mark size=는 반지름(기본값 2pt)을 정합니다. 속이 채워진 모양은 이름이 *로 끝납니다. mark options는 마커에만 스타일을 적용하며, 예를 들어 흰색으로 채운 빈 마커를 만들 수 있습니다.
계열마다 다른 마커
\begin{tikzpicture}
  \begin{axis}[enlargelimits=0.15, legend pos=outer north east]
    \addplot[only marks, mark=o, blue] coordinates {(1,2) (2,3) (3,2.5)};
    \addplot[only marks, mark=square*, red, mark size=3pt] coordinates {(1,1) (2,1.8) (3,1.2)};
    \addplot[only marks, mark=triangle*, teal, mark options={fill=white}] coordinates {(1,3) (2,4) (3,3.8)};
    \addplot[only marks, mark=x, black, mark size=4pt] coordinates {(1.5,0.5) (2.5,0.8)};
    \legend{circle, square, triangle, cross}
  \end{axis}
\end{tikzpicture}
작동하는 모양은 선 그래프 페이지에 정리되어 있습니다.
표에서 읽은 점
점이 몇 개를 넘으면 표로 쓰세요. 첫 줄에 열 이름을 적고, x=와 y=로 그릴 열을 고릅니다. 표는 여기처럼 코드 안에 둘 수도 있고 파일로 둘 수도 있습니다(CSV 파일의 데이터 참고).
코드 안의 표에서 읽은 점
\begin{tikzpicture}
  \begin{axis}[xlabel={Hours studied}, ylabel={Points}]
    \addplot[only marks, mark=*, blue!70!black] table[x=hours, y=points] {
      hours points
      2     21
      3     26
      4     30
      5     29
      6     37
      7     40
      8     44
    };
    \addplot[red, domain=2:8] {13.5 + 3.8*x};
  \end{axis}
\end{tikzpicture}
빨간 선은 점들 위에 그린 수식으로, 적합한 추세를 보여 주는 간단한 방법입니다.
값에 따라 점에 색 입히기
scatter를 쓰면 각 점이 값에 따라 컬러맵의 색을 받습니다. point meta=y는 y 값을 쓰고, scatter src=explicit과 meta=를 함께 쓰면 세 번째 열을 읽습니다. 축척을 보여 주려면 colorbar를 넣으세요.
세 번째 열의 값으로 색을 입힌 점
\begin{tikzpicture}
  \begin{axis}[colorbar, colormap/viridis, xlabel=$x$, ylabel=$y$]
    \addplot[scatter, only marks, mark size=3pt, scatter src=explicit]
      table[x=x, y=y, meta=t] {
      x   y   t
      0.5 1.0 10
      1.0 2.2 15
      1.6 1.4 21
      2.1 3.0 28
      2.8 2.1 33
      3.3 3.6 44
    };
  \end{axis}
\end{tikzpicture}
점의 분류
pgfplots에서 scatter/classes는 열에 적힌 분류 이름마다 다른 마커를 줍니다. Scissor LaTeX는 아직 이를 지원하지 않습니다. 이 옵션은 메시지를 남기고 무시되며, 모든 점이 같은 마커로 그려집니다.
scatter/classes: 모든 점에 같은 마커
\begin{tikzpicture}
  \begin{axis}[width=6cm, height=5cm]
    \addplot[scatter, only marks, scatter src=explicit symbolic,
             scatter/classes={a={mark=square*, blue}, b={mark=*, red}}]
      table[meta=group] {
      x y group
      1 1 a
      2 2 b
      3 1.5 a
    };
  \end{axis}
\end{tikzpicture}
문제 탭: pgfplots option 'scatter/classes' is not supported yet
TeX 설치 환경과 다른 점
마커와 scatter 옵션의 자세한 내용은 pgfplots 설명서에 있습니다: ctan.org/pkg/pgfplots.
질문과 답변
선 없는 산점도는 어떻게 만드나요?
\addplot 옵션에 only marks를 넣으세요. 예: \addplot+[only marks] coordinates {...};.
점 크기는 어떻게 바꾸나요?
\addplot에 mark size=3pt를 쓰세요. 값은 마커의 반지름입니다.
CSV 파일의 점을 그릴 수 있나요?
네. 파일을 프로젝트에 업로드하고 \addplot+[only marks] table[x=a, y=b, col sep=comma] {file.csv};라고 쓰세요.
이 페이지의 모든 예제는 사이트를 빌드할 때 Scissor LaTeX로 조판됩니다. 마지막 업데이트: 2026-11-07