


從 CSV 檔案繪製資料
把檔案加入你的專案,然後在 pgfplots 的 axis 中寫 \addplot table[x=col1, y=col2, col sep=comma] {file.csv};。
繪製檔案中的兩個欄位
把 CSV 檔案上傳到你的專案(或直接在專案中建立)。第一行為欄位命名。x= 和 y= 依名稱選擇欄位,col sep=comma 則表示數值以逗號分隔。
本頁使用一個小檔案 data-from-csv-weather.csv:
month,temp,rain,sd
1,1.2,44,0.8
2,2.0,38,0.7
3,5.6,41,0.9
...
12,2.3,46,0.8
CSV 檔案中每月的氣溫
\begin{tikzpicture}
  \begin{axis}[xlabel={Month}, ylabel={Temperature ($^\circ$C)}, xtick={1,...,12}]
    \addplot table[x=month, y=temp, col sep=comma] {data-from-csv-weather.csv};
  \end{axis}
\end{tikzpicture}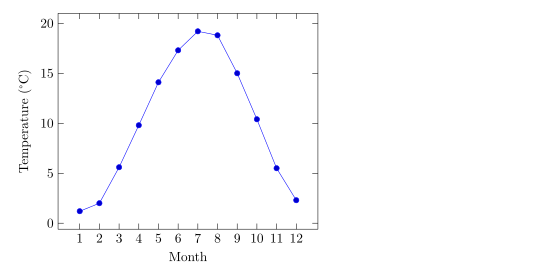
資料夾中的檔案也可以使用:按照專案中的路徑寫出,例如 {data/weather.csv}。
多個欄位、誤差欄位與計算值
每個系列讀取一次同一個檔案。y error= 從欄位取得誤差線,y expr= 則從該列計算出一個值,用 \thisrow{name} 表示某個欄位。
同一個檔案中的兩個系列
\begin{tikzpicture}
  \begin{axis}[xlabel={Month}, ylabel={Value}, legend pos=north west, ymin=0]
    \addplot+[error bars/.cd, y dir=both, y explicit]
      table[x=month, y=temp, y error=sd, col sep=comma] {data-from-csv-weather.csv};
    \addplot+[mark=none, dashed]
      table[x=month, y expr=\thisrow{rain}/2, col sep=comma] {data-from-csv-weather.csv};
    \legend{Temperature ($^\circ$C), Rain / 2 (mm)}
  \end{axis}
\end{tikzpicture}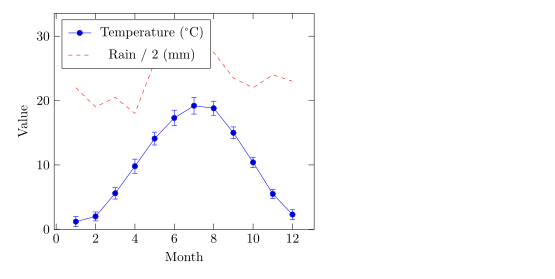
只讀取一次表格
\pgfplotstableread 會把檔案讀進一個巨集,之後每個 \addplot 都能使用它。當同一個表格要供多個圖表使用時,這樣寫比較簡短。
\pgfplotstableread 與圖表
\pgfplotstableread[col sep=comma]{data-from-csv-weather.csv}\weather
\begin{tikzpicture}
  \begin{axis}[ybar, bar width=6pt, ymin=0, xlabel={Month}, ylabel={Rain (mm)},
               xtick={1,...,12}, enlarge x limits=0.06]
    \addplot table[x=month, y=rain] {\weather};
  \end{axis}
\end{tikzpicture}
文件中的資料:filecontents
小型資料集可以直接放在 .tex 檔案中。filecontents* 會把它的內容寫成一個指定名稱的檔案,再由 \addplot table 讀取。這個檔案放在導言區,也就是 \begin{document} 之前。
用 filecontents* 寫出的資料
\documentclass{article}
\usepackage{pgfplots}
\begin{filecontents*}{speed.dat}
t   v
0   0
1   4.4
2   8.1
3   11.0
4   13.2
\end{filecontents*}
\begin{document}
\begin{tikzpicture}
  \begin{axis}[xlabel={Time (s)}, ylabel={Speed (m/s)}]
    \addplot table[x=t, y=v] {speed.dat};
  \end{axis}
\end{tikzpicture}
\end{document}
這裡的欄位以空白分隔,這是 pgfplots 的預設值,所以不需要 col sep。
表格選項
| 選項 | 作用 | 在 Scissor LaTeX 中 |
|---|---|---|
x=name、y=name | 依名稱選擇欄位 | 可以使用 |
x index=0、y index=1 | 依編號選擇欄位,從 0 開始 | 可以使用 |
col sep=comma | 也可以是 space、tab、semicolon、& | 可以使用 |
header=false | 第一行是資料,而不是欄位名稱 | 可以使用 |
skip first n=2 | 忽略開頭的幾行 | 可以使用 |
x expr=、y expr= | 計算數值,可用 \thisrow{name}、\thisrowno{n} 或 \coordindex | 可以使用 |
y error=、x error= | 誤差線欄位 | 可以使用 |
comment chars=! | 更多註解字元(以 # 和 % 開頭的行一律略過) | 可以使用 |
\pgfplotstableread | 把表格讀進巨集 | 可以使用 |
\pgfplotstabletypeset | 把表格印成 LaTeX 表格 | 不支援:會被略過並顯示訊息 |
空白儲存格、nan 和 inf 會被視為缺少的值而省略。
出問題時
如果讀取 .csv 檔案時沒有加上 col sep=comma,Scissor LaTeX 仍會找出逗號,所以圖表會畫出來,但「問題」分頁會提醒你加上這個選項。TeX 安裝環境不會自行猜測,圖表在那裡會失敗。
缺少 col sep:仍會繪製,並附上提醒
\begin{tikzpicture}
  \begin{axis}[width=6cm, height=4.5cm]
    \addplot table[x=month, y=temp] {data-from-csv-weather.csv};
  \end{axis}
\end{tikzpicture}
「問題」分頁: Add col sep=comma to read data-from-csv-weather.csv so it also works in LaTeX
如果檔案不在專案中,該圖就會被省略。座標軸仍會繪製,「問題」分頁會列出缺少的檔案名稱。
缺少的檔案
\begin{tikzpicture}
  \begin{axis}[width=6cm, height=4.5cm]
    \addplot table[col sep=comma] {results.csv};
  \end{axis}
\end{tikzpicture}
「問題」分頁: Data file not in the project: results.csv
與 TeX 安裝環境的差異
這裡的一切都是 pgfplots 語法,所以這些檔案在 TeX 安裝環境中也能編譯。手冊:ctan.org/pkg/pgfplots。從欄位讀取誤差線,請參閱誤差線。
常見問題
怎麼在 LaTeX 中繪製 CSV 檔案?
把檔案放進專案,然後在座標軸中寫 \addplot table[x=a, y=b, col sep=comma] {file.csv};,把 a 和 b 換成你的欄位名稱。
我的 CSV 用分號分隔,要怎麼寫?
使用 col sep=semicolon。如果是 Tab 字元,請用 col sep=tab。
可以把某個欄位對應列號來繪製嗎?
可以:table[x expr=\coordindex, y=name] 會使用 0、1、2 等作為 x 值。
本頁的每個範例都在建置網站時由 Scissor LaTeX 排版。 最後更新:2026-11-07