


pgfplots の棒グラフ
pgfplots の axis に ybar(縦棒)か xbar(横棒)を追加し、symbolic x coords でカテゴリに名前を付け、各系列を座標付きの \addplot で指定します。
名前付きのカテゴリの縦棒
軸に ybar を指定すると、すべての系列が棒になります。symbolic x coords でカテゴリ名を順に並べ、xtick=data で各棒の下に目盛りを 1 つずつ置きます。
1 系列の棒
\begin{tikzpicture}
  \begin{axis}[
      ybar, ymin=0,
      symbolic x coords={Mon, Tue, Wed, Thu, Fri},
      xtick=data,
      ylabel={Visitors},
      enlarge x limits=0.15,
    ]
    \addplot coordinates {(Mon,44) (Tue,31) (Wed,38) (Thu,27) (Fri,40)};
  \end{axis}
\end{tikzpicture}
棒は 0 から始まります。ymin=0 がないと軸は 0 の下に少し余白を取るので、棒が枠の上に立つように指定しましょう。enlarge x limits は左右に余白を取り、両端の棒が枠で切れないようにします。
グループ化した棒と値のラベル
系列が複数あると、各カテゴリの棒が横に並びます。nodes near coords は各棒の上に値を表示し、bar width で幅(デフォルトは 10pt)を指定します。
棒に値を表示した 2 系列
\begin{tikzpicture}
  \begin{axis}[
      ybar, ymin=0, ymax=55, bar width=12pt,
      symbolic x coords={Erika, Hans, John},
      xtick=data, enlarge x limits=0.25,
      nodes near coords,
      ylabel={Points},
      legend style={at={(0.5,-0.12)}, anchor=north, legend columns=2},
    ]
    \addplot coordinates {(Erika,44) (Hans,31) (John,38)};
    \addplot coordinates {(Erika,40) (Hans,36) (John,29)};
    \legend{Round 1, Round 2}
  \end{axis}
\end{tikzpicture}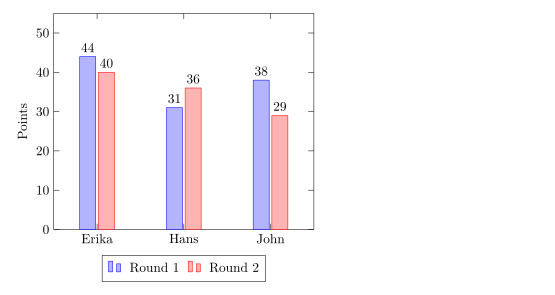
ybar=4pt で、グループ内の棒の間隔(デフォルトは 2pt)を指定します。
積み上げ棒グラフ
ybar stacked は、系列を横に並べる代わりに積み重ねます。2 つ目の \addplot は 1 つ目の終わりから始まります。
四半期ごとの積み上げ棒
\begin{tikzpicture}
  \begin{axis}[
      ybar stacked, ymin=0, bar width=16pt,
      symbolic x coords={Q1, Q2, Q3, Q4},
      xtick=data, enlarge x limits=0.2,
      legend pos=north west, ylabel={Sales},
    ]
    \addplot coordinates {(Q1,12) (Q2,18) (Q3,15) (Q4,22)};
    \addplot coordinates {(Q1,6) (Q2,9) (Q3,12) (Q4,10)};
    \legend{Online, In store}
  \end{axis}
\end{tikzpicture}
横棒
xbar は棒を左から右へ描きます。軸の役割を入れ替え、カテゴリは symbolic y coords と ytick=data に書き、各座標は(値, カテゴリ)の順に書きます。
横棒
\begin{tikzpicture}
  \begin{axis}[
      xbar, xmin=0, xmax=50,
      symbolic y coords={Rust, Python, C},
      ytick=data, enlarge y limits=0.3,
      nodes near coords, xlabel={Projects},
      width=8cm, height=5cm,
    ]
    \addplot coordinates {(44,Rust) (31,Python) (12,C)};
  \end{axis}
\end{tikzpicture}
xbar stacked も使えます。
数値のカテゴリ
年などの数値には symbolic x coords は必要ありません。数値としてプロットし、xtick=data を使います。pgfplots はデフォルトで 2024 を「2,024」と書くので、目盛りラベルのスタイルで千の位の区切りをオフにします。
x 軸の年
\begin{tikzpicture}
  \begin{axis}[
      ybar, ymin=0, xtick=data, enlarge x limits=0.25,
      x tick label style={/pgf/number format/1000 sep=},
    ]
    \addplot coordinates {(2023,18) (2024,31) (2025,44)};
  \end{axis}
\end{tikzpicture}オプション一覧
| オプション | 働き | Scissor LaTeX での対応 |
|---|---|---|
ybar、xbar | 横に並ぶ縦棒または横棒 | 使える |
ybar=4pt | 1 つのグループ内の棒の間隔 | 使える |
ybar stacked、xbar stacked | 積み重ねた棒 | 線形の軸で使える |
bar width=12pt | 各棒の幅 | 使える |
bar shift=.. | 系列を横にずらす | 使える |
nodes near coords | 各棒の上(または横)の値 | 使える |
symbolic x coords、symbolic y coords | 名前付きのカテゴリ | 使える。ただし数値に見える名前は不可(目盛りラベルなし) |
xticklabel style={rotate=45, anchor=east} | 斜めのカテゴリ名 | 使える |
ybar interval | x の値の間を埋める棒 | 一部対応:x の値の位置に通常の棒として描かれる |
hist(statistics ライブラリ) | 値を階級に数え分ける | 未対応:メッセージ付きで無視され、元の値が線で描かれる |
TeX のインストール環境との違い
このページの例は、TeX のインストール環境の pgfplots でもすべてコンパイルできます。マニュアル:ctan.org/pkg/pgfplots。
pgfplots の基本、誤差棒、CSV のデータ、pgfplots もご覧ください。
よくある質問
LaTeX で棒グラフを作るにはどうすればよいですか?
pgfplots を読み込み、\begin{axis}[ybar, symbolic x coords={A,B,C}, xtick=data] と書いて、系列ごとに \addplot coordinates {(A,3) (B,5) (C,2)}; を 1 つずつ追加します。
棒の上に値を表示するにはどうすればよいですか?
軸のオプションに nodes near coords を追加します。各棒に値がラベルとして付きます。
棒を 0 から始めるにはどうすればよいですか?
棒はもともと 0 から始まります。棒の下の余白をなくすには、軸に ymin=0(xbar なら xmin=0)を指定します。
このページの例はすべて、サイトのビルド時に Scissor LaTeX で組版されています。 最終更新:2026-11-07