


用 pgfplots 繪製長條圖
在 pgfplots 的 axis 上加上 ybar(垂直長條)或 xbar(水平長條),用 symbolic x coords 為類別命名,並以帶座標的 \addplot 寫出每個系列。
具名類別的垂直長條
座標軸上的 ybar 會把每個系列變成長條。symbolic x coords 依序列出類別名稱,xtick=data 則在每個長條下方放一個刻度。
一個系列的長條
\begin{tikzpicture}
  \begin{axis}[
      ybar, ymin=0,
      symbolic x coords={Mon, Tue, Wed, Thu, Fri},
      xtick=data,
      ylabel={Visitors},
      enlarge x limits=0.15,
    ]
    \addplot coordinates {(Mon,44) (Tue,31) (Wed,38) (Thu,27) (Fri,40)};
  \end{axis}
\end{tikzpicture}
長條從零開始。沒有 ymin=0 時,座標軸會在零的下方多留一點空間,所以請設定它,讓長條立在外框上。enlarge x limits 會在兩側多留空間,讓最外側的長條不會被外框切到。
分組長條與數值標籤
有多個系列時,每個類別的長條會並排。nodes near coords 會把每個數值印在對應長條的上方,bar width 則設定寬度(預設 10pt)。
兩個系列,長條上標示數值
\begin{tikzpicture}
  \begin{axis}[
      ybar, ymin=0, ymax=55, bar width=12pt,
      symbolic x coords={Erika, Hans, John},
      xtick=data, enlarge x limits=0.25,
      nodes near coords,
      ylabel={Points},
      legend style={at={(0.5,-0.12)}, anchor=north, legend columns=2},
    ]
    \addplot coordinates {(Erika,44) (Hans,31) (John,38)};
    \addplot coordinates {(Erika,40) (Hans,36) (John,29)};
    \legend{Round 1, Round 2}
  \end{axis}
\end{tikzpicture}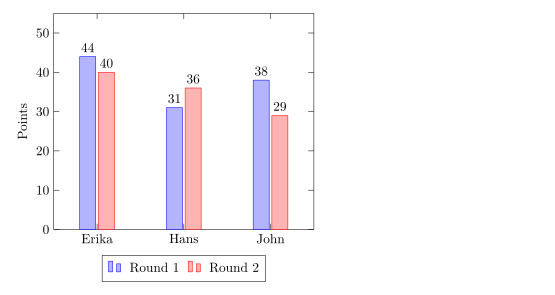
ybar=4pt 設定同一組長條之間的間距(預設 2pt)。
堆疊長條
ybar stacked 會把各系列疊在一起,而不是並排。第二個 \addplot 從第一個結束的地方開始。
每季的堆疊長條
\begin{tikzpicture}
  \begin{axis}[
      ybar stacked, ymin=0, bar width=16pt,
      symbolic x coords={Q1, Q2, Q3, Q4},
      xtick=data, enlarge x limits=0.2,
      legend pos=north west, ylabel={Sales},
    ]
    \addplot coordinates {(Q1,12) (Q2,18) (Q3,15) (Q4,22)};
    \addplot coordinates {(Q1,6) (Q2,9) (Q3,12) (Q4,10)};
    \legend{Online, In store}
  \end{axis}
\end{tikzpicture}
水平長條
xbar 會由左向右畫出長條。請對調兩軸的角色:類別放在 symbolic y coords 和 ytick=data 中,每個座標寫成(數值, 類別)。
水平長條
\begin{tikzpicture}
  \begin{axis}[
      xbar, xmin=0, xmax=50,
      symbolic y coords={Rust, Python, C},
      ytick=data, enlarge y limits=0.3,
      nodes near coords, xlabel={Projects},
      width=8cm, height=5cm,
    ]
    \addplot coordinates {(44,Rust) (31,Python) (12,C)};
  \end{axis}
\end{tikzpicture}
xbar stacked 也可以使用。
以數字作為類別
年份和其他數字不需要 symbolic x coords:把它們當作數字繪製,並使用 xtick=data。pgfplots 預設會把 2024 寫成「2,024」;請在刻度標籤樣式中關閉千位分隔符號。
x 軸上的年份
\begin{tikzpicture}
  \begin{axis}[
      ybar, ymin=0, xtick=data, enlarge x limits=0.25,
      x tick label style={/pgf/number format/1000 sep=},
    ]
    \addplot coordinates {(2023,18) (2024,31) (2025,44)};
  \end{axis}
\end{tikzpicture}選項一覽
| 選項 | 作用 | 在 Scissor LaTeX 中 |
|---|---|---|
ybar、xbar | 並排的垂直或水平長條 | 可以使用 |
ybar=4pt | 同一組長條之間的間距 | 可以使用 |
ybar stacked、xbar stacked | 疊在一起的長條 | 在線性座標軸上可以使用 |
bar width=12pt | 每個長條的寬度 | 可以使用 |
bar shift=.. | 把一個系列向旁邊移動 | 可以使用 |
nodes near coords | 每個長條上方(或旁邊)的數值 | 可以使用 |
symbolic x coords、symbolic y coords | 具名類別 | 可以使用,但看起來像數字的名稱除外(沒有刻度標籤) |
xticklabel style={rotate=45, anchor=east} | 傾斜的類別名稱 | 可以使用 |
ybar interval | 填滿 x 值之間空間的長條 | 部分支援:在 x 值處畫成一般長條 |
hist(statistics 函式庫) | 把數值分組計數 | 不支援:會被忽略並顯示訊息,原始數值會畫成一條線 |
與 TeX 安裝環境的差異
本頁的所有範例在 TeX 安裝環境中搭配 pgfplots 也能編譯。手冊:ctan.org/pkg/pgfplots。
另請參閱 pgfplots 基礎、誤差線、從 CSV 讀取資料和 pgfplots。
常見問題
怎麼在 LaTeX 中製作長條圖?
載入 pgfplots,寫 \begin{axis}[ybar, symbolic x coords={A,B,C}, xtick=data],每個系列加上一個 \addplot coordinates {(A,3) (B,5) (C,2)};。
怎麼在長條上方顯示數值?
在座標軸選項中加上 nodes near coords。每個長條都會以它的數值作為標籤。
怎麼讓長條從零開始?
它們本來就從零開始。在座標軸上設定 ymin=0(xbar 則是 xmin=0),就能移除下方的空間。
本頁的每個範例都在建置網站時由 Scissor LaTeX 排版。 最後更新:2026-11-07