


أشرطة الخطأ باستخدام pgfplots
أضف error bars/.cd, y dir=both, y explicit إلى خيارات \addplot واكتب كل خطأ بعد نقطته على شكل +- (0, error)، أو اقرأ الأخطاء من عمود جدول باستخدام y error=.
أخطاء مكتوبة مع النقاط
تُفعَّل أشرطة الخطأ لكل \addplot على حدة. تحدد المفاتيح بعد error bars/.cd الاتجاه الذي تُرسم فيه ومصدر القيم. ومع y explicit تحمل كل نقطة خطأها الخاص بعد +-.
أخطاء y متماثلة من الإحداثيات
\begin{tikzpicture}
  \begin{axis}[xlabel={Length (m)}, ylabel={Period (s)}]
    \addplot+[error bars/.cd, y dir=both, y explicit]
      coordinates {
        (0.2,0.90) +- (0,0.05)
        (0.4,1.27) +- (0,0.04)
        (0.6,1.55) +- (0,0.06)
        (0.8,1.80) +- (0,0.05)
        (1.0,2.01) +- (0,0.07)
      };
  \end{axis}
\end{tikzpicture}
في +- (ex, ey) الرقم الأول هو خطأ x والثاني خطأ y. ولا يُرسم إلا الاتجاهان اللذان تفعّلهما.
أخطاء من عمود جدول
عندما تكون البيانات جدولًا، سمِّ عمود الخطأ باستخدام y error=. ويعمل الأمر نفسه مع ملف، مثل table[x=t, y=v, y error=dv, col sep=comma] {data.csv}.
أخطاء y مقروءة من عمود
\begin{tikzpicture}
  \begin{axis}[xlabel={Dose}, ylabel={Response}, ymin=0]
    \addplot+[only marks, error bars/.cd, y dir=both, y explicit]
      table[x=dose, y=mean, y error=sd] {
        dose mean sd
        1    2.1  0.3
        2    3.4  0.4
        4    5.0  0.6
        8    6.2  0.5
      };
  \end{axis}
\end{tikzpicture}
أخطاء أحادية الجانب وثابتة
يرسم y dir=plus أو y dir=minus النصف العلوي أو السفلي فقط. وبدلًا من القيم الصريحة، يعطي y fixed=0.2 كل نقطة الخطأ نفسه، ويعطي y fixed relative=0.1 خطأً قدره 10% من قيمتها.
أخطاء علوية فقط، وخطأ نسبي
\begin{tikzpicture}
  \begin{axis}[ymin=0, legend pos=north west]
    \addplot+[error bars/.cd, y dir=plus, y fixed=0.4]
      coordinates {(1,2) (2,3) (3,3.5) (4,4.4)};
    \addplot+[error bars/.cd, y dir=both, y fixed relative=0.1]
      coordinates {(1,1) (2,1.6) (3,2.2) (4,2.5)};
    \legend{fixed $\pm 0.4$ (upper), relative 10\%}
  \end{axis}
\end{tikzpicture}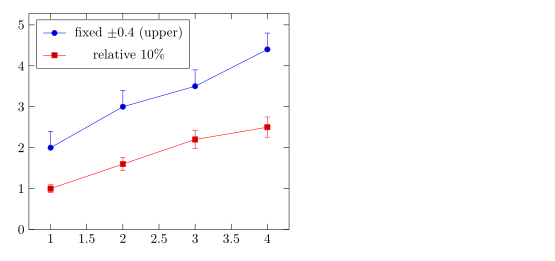
أخطاء مختلفة فوق النقطة وتحتها
اكتب += (0, up) للخطأ العلوي و-= (0, down) للخطأ السفلي.
أخطاء غير متماثلة
\begin{tikzpicture}
  \begin{axis}[width=7cm, height=5cm, xmin=0.5, xmax=3.5]
    \addplot+[only marks, error bars/.cd, y dir=both, y explicit]
      coordinates {
        (1,2.0) += (0,0.5) -= (0,0.1)
        (2,3.0) += (0,0.2) -= (0,0.6)
        (3,2.6) += (0,0.3) -= (0,0.3)
      };
  \end{axis}
\end{tikzpicture}
أخطاء في x وy
فعّل الاتجاهين معًا باستخدام x dir وy dir. ويُنسّق error bar style الأشرطة.
أشرطة خطأ في الاتجاهين
\begin{tikzpicture}
  \begin{axis}[xlabel=$x$, ylabel=$y$]
    \addplot+[only marks, mark=square*,
              error bars/.cd,
                x dir=both, x explicit,
                y dir=both, y explicit,
                error bar style={red, thick}]
      coordinates {
        (1.0,1.2) +- (0.15,0.20)
        (2.0,2.1) +- (0.20,0.15)
        (3.0,2.8) +- (0.10,0.30)
      };
  \end{axis}
\end{tikzpicture}
نطاقات الخطأ باستخدام fill between
لعدم يقين متصل، ظلّل المساحة بين منحنى علوي ومنحنى سفلي. حمّل مكتبة fillbetween، وسمِّ المنحنيين باستخدام name path، واملأ ما بينهما.
نطاق مظلّل حول منحنى
\documentclass{article}
\usepackage{pgfplots}
\usepgfplotslibrary{fillbetween}
\begin{document}
\begin{tikzpicture}
  \begin{axis}[domain=0:4, samples=40, xlabel=$t$, ylabel=$y$]
    \addplot[name path=upper, draw=none] {exp(-0.5*x) + 0.1 + 0.05*x};
    \addplot[name path=lower, draw=none] {exp(-0.5*x) - 0.1 - 0.05*x};
    \addplot[blue!20] fill between[of=upper and lower];
    \addplot[blue, thick] {exp(-0.5*x)};
  \end{axis}
\end{tikzpicture}
\end{document}
خيارات أشرطة الخطأ
| الخيار | ما يفعله | في Scissor LaTeX |
|---|---|---|
y dir=both، plus، minus، none | أي نصف من الشريط يُرسم (وكذلك x dir) | يعمل |
y explicit، x explicit | أخطاء من +- في الإحداثيات أو من عمود جدول | يعمل |
y error=col، x error=col، y error index=n | عمود الجدول الذي يحوي الأخطاء | يعمل |
+= (ex,ey)، -= (ex,ey) | أخطاء علوية وسفلية منفصلة في الإحداثيات | يعمل |
y fixed=v، y fixed relative=r | الخطأ نفسه لكل نقطة | يعمل |
error bar style={..} | لون الأشرطة وسُمك خطها | يعمل |
error mark=..، error mark options={..} | الطرف عند كل نهاية | مقبول، لكن الطرف يكون دائمًا خطًا قصيرًا |
ما الذي يختلف عن تثبيت TeX
يصف دليل pgfplots أشرطة الخطأ في القسم المخصص لها: ctan.org/pkg/pgfplots.
راجع أيضًا المخططات الشريطية ورسوم النقاط المبعثرة والبيانات من CSV.
أسئلة وأجوبة
كيف أضيف أشرطة الخطأ في pgfplots؟
اكتب \addplot+[error bars/.cd, y dir=both, y explicit] coordinates {(1,2) +- (0,0.3) ...};. الرقم الثاني بعد +- هو خطأ y.
كيف أقرأ أشرطة الخطأ من ملف CSV؟
أضف y error=column إلى خيارات الجدول، مع y explicit في خيارات أشرطة الخطأ: table[x=a, y=b, y error=c, col sep=comma] {file.csv}.
هل يمكن أن تختلف أشرطة الخطأ فوق النقطة وتحتها؟
نعم. اكتب += (0, up) و-= (0, down) بعد النقطة بدلًا من +-، كما في (1,2) += (0,0.5) -= (0,0.1).
كل مثال في هذه الصفحة ينضّده Scissor LaTeX عند بناء الموقع. آخر تحديث: 2026-11-07.