


Error bars gamit ang pgfplots
Idagdag ang error bars/.cd, y dir=both, y explicit sa options ng \addplot at isulat ang bawat error pagkatapos ng point nito bilang +- (0, error), o basahin ang errors mula sa isang table column gamit ang y error=.
Errors na isinulat kasama ng mga point
Ina-on ang error bars bawat \addplot. Sinasabi ng mga key pagkatapos ng error bars/.cd kung saang direksyon sila iguguhit at kung saan galing ang values. Gamit ang y explicit, may sariling error ang bawat point pagkatapos ng +-.
Symmetric na y errors mula sa coordinates
\begin{tikzpicture}
  \begin{axis}[xlabel={Length (m)}, ylabel={Period (s)}]
    \addplot+[error bars/.cd, y dir=both, y explicit]
      coordinates {
        (0.2,0.90) +- (0,0.05)
        (0.4,1.27) +- (0,0.04)
        (0.6,1.55) +- (0,0.06)
        (0.8,1.80) +- (0,0.05)
        (1.0,2.01) +- (0,0.07)
      };
  \end{axis}
\end{tikzpicture}
Sa +- (ex, ey), ang unang numero ang x error at ang pangalawa ang y error. Ang mga direksyong in-on mo lang ang iginuguhit.
Errors mula sa isang table column
Kapag table ang data, pangalanan ang error column gamit ang y error=. Ganoon din sa isang file, halimbawa table[x=t, y=v, y error=dv, col sep=comma] {data.csv}.
y errors na binasa mula sa isang column
\begin{tikzpicture}
  \begin{axis}[xlabel={Dose}, ylabel={Response}, ymin=0]
    \addplot+[only marks, error bars/.cd, y dir=both, y explicit]
      table[x=dose, y=mean, y error=sd] {
        dose mean sd
        1    2.1  0.3
        2    3.4  0.4
        4    5.0  0.6
        8    6.2  0.5
      };
  \end{axis}
\end{tikzpicture}
One-sided at fixed errors
Iginuguhit lang ng y dir=plus o y dir=minus ang itaas o ibabang kalahati. Sa halip na explicit values, binibigyan ng y fixed=0.2 ang bawat point ng parehong error, at ng y fixed relative=0.1 ng error na 10% ng value nito.
Upper errors lang, at isang relative error
\begin{tikzpicture}
  \begin{axis}[ymin=0, legend pos=north west]
    \addplot+[error bars/.cd, y dir=plus, y fixed=0.4]
      coordinates {(1,2) (2,3) (3,3.5) (4,4.4)};
    \addplot+[error bars/.cd, y dir=both, y fixed relative=0.1]
      coordinates {(1,1) (2,1.6) (3,2.2) (4,2.5)};
    \legend{fixed $\pm 0.4$ (upper), relative 10\%}
  \end{axis}
\end{tikzpicture}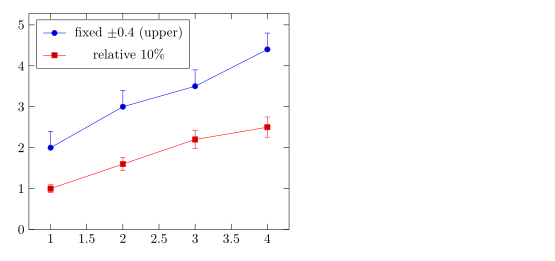
Magkaibang errors sa itaas at ibaba
Isulat ang += (0, up) para sa upper error at ang -= (0, down) para sa lower error.
Asymmetric na errors
\begin{tikzpicture}
  \begin{axis}[width=7cm, height=5cm, xmin=0.5, xmax=3.5]
    \addplot+[only marks, error bars/.cd, y dir=both, y explicit]
      coordinates {
        (1,2.0) += (0,0.5) -= (0,0.1)
        (2,3.0) += (0,0.2) -= (0,0.6)
        (3,2.6) += (0,0.3) -= (0,0.3)
      };
  \end{axis}
\end{tikzpicture}
Errors sa x at y
I-on ang dalawang direksyon gamit ang x dir at y dir. Ini-style ng error bar style ang bars.
Error bars sa dalawang direksyon
\begin{tikzpicture}
  \begin{axis}[xlabel=$x$, ylabel=$y$]
    \addplot+[only marks, mark=square*,
              error bars/.cd,
                x dir=both, x explicit,
                y dir=both, y explicit,
                error bar style={red, thick}]
      coordinates {
        (1.0,1.2) +- (0.15,0.20)
        (2.0,2.1) +- (0.20,0.15)
        (3.0,2.8) +- (0.10,0.30)
      };
  \end{axis}
\end{tikzpicture}
Error bands gamit ang fill between
Para sa tuloy-tuloy na uncertainty, kulayan ang lugar sa pagitan ng upper at lower curve. I-load ang fillbetween library, pangalanan ang dalawang curve gamit ang name path, at punuin ang pagitan nila.
Kinulayang band sa paligid ng isang curve
\documentclass{article}
\usepackage{pgfplots}
\usepgfplotslibrary{fillbetween}
\begin{document}
\begin{tikzpicture}
  \begin{axis}[domain=0:4, samples=40, xlabel=$t$, ylabel=$y$]
    \addplot[name path=upper, draw=none] {exp(-0.5*x) + 0.1 + 0.05*x};
    \addplot[name path=lower, draw=none] {exp(-0.5*x) - 0.1 - 0.05*x};
    \addplot[blue!20] fill between[of=upper and lower];
    \addplot[blue, thick] {exp(-0.5*x)};
  \end{axis}
\end{tikzpicture}
\end{document}
Mga option ng error bar
| Option | Ano ang ginagawa nito | Sa Scissor LaTeX |
|---|---|---|
y dir=both, plus, minus, none | aling kalahati ng bar ang iguguhit (pati x dir) | Gumagana |
y explicit, x explicit | errors mula sa +- sa coordinates o mula sa isang table column | Gumagana |
y error=col, x error=col, y error index=n | ang table column na may errors | Gumagana |
+= (ex,ey), -= (ex,ey) | hiwalay na upper at lower errors sa coordinates | Gumagana |
y fixed=v, y fixed relative=r | parehong error para sa bawat point | Gumagana |
error bar style={..} | kulay at kapal ng linya ng bars | Gumagana |
error mark=.., error mark options={..} | ang cap sa bawat dulo | Tinatanggap, pero laging maikling linya ang cap |
Ang naiiba sa isang TeX installation
Inilalarawan ng pgfplots manual ang error bars sa section nito tungkol sa error bars: ctan.org/pkg/pgfplots.
Tingnan din ang Bar charts, Scatter plots at Data mula sa CSV.
Mga tanong at sagot
Paano ako magdadagdag ng error bars sa pgfplots?
Isulat ang \addplot+[error bars/.cd, y dir=both, y explicit] coordinates {(1,2) +- (0,0.3) ...};. Ang pangalawang numero pagkatapos ng +- ang y error.
Paano ko babasahin ang error bars mula sa CSV file?
Idagdag ang y error=column sa table options, kasama ang y explicit sa error bar options: table[x=a, y=b, y error=c, col sep=comma] {file.csv}.
Puwede bang magkaiba ang error bars sa itaas at ibaba?
Oo. Isulat ang += (0, up) at -= (0, down) pagkatapos ng point sa halip na +-, gaya ng (1,2) += (0,0.5) -= (0,0.1).
Bawat halimbawa sa page na ito ay tina-typeset ng Scissor LaTeX kapag binubuo ang site. Huling na-update noong 2026-11-07.