


קווי שגיאה עם pgfplots
מוסיפים error bars/.cd, y dir=both, y explicit לאפשרויות של \addplot וכותבים כל שגיאה אחרי הנקודה שלה בצורה +- (0, error), או קוראים את השגיאות מעמודה בטבלה עם y error=.
שגיאות שנכתבות עם הנקודות
קווי שגיאה מופעלים לכל \addplot בנפרד. המפתחות אחרי error bars/.cd אומרים באיזה כיוון לצייר אותם ומאיפה מגיעים הערכים. עם y explicit, כל נקודה נושאת את השגיאה שלה אחרי +-.
שגיאות y סימטריות מתוך הקואורדינטות
\begin{tikzpicture}
  \begin{axis}[xlabel={Length (m)}, ylabel={Period (s)}]
    \addplot+[error bars/.cd, y dir=both, y explicit]
      coordinates {
        (0.2,0.90) +- (0,0.05)
        (0.4,1.27) +- (0,0.04)
        (0.6,1.55) +- (0,0.06)
        (0.8,1.80) +- (0,0.05)
        (1.0,2.01) +- (0,0.07)
      };
  \end{axis}
\end{tikzpicture}ב-+- (ex, ey) המספר הראשון הוא שגיאת ה-x והשני שגיאת ה-y. מצוירים רק הכיוונים שהפעלת.
שגיאות מעמודה בטבלה
כשהנתונים הם טבלה, נותנים את שם עמודת השגיאה עם y error=. אותו דבר עובד עם קובץ, למשל table[x=t, y=v, y error=dv, col sep=comma] {data.csv}.
שגיאות y שנקראות מעמודה
\begin{tikzpicture}
  \begin{axis}[xlabel={Dose}, ylabel={Response}, ymin=0]
    \addplot+[only marks, error bars/.cd, y dir=both, y explicit]
      table[x=dose, y=mean, y error=sd] {
        dose mean sd
        1    2.1  0.3
        2    3.4  0.4
        4    5.0  0.6
        8    6.2  0.5
      };
  \end{axis}
\end{tikzpicture}
שגיאות חד-צדדיות וקבועות
y dir=plus או y dir=minus מצייר רק את החצי העליון או התחתון. במקום ערכים מפורשים, y fixed=0.2 נותן לכל נקודה אותה שגיאה, ו-y fixed relative=0.1 שגיאה של 10% מהערך שלה.
שגיאות עליונות בלבד, ושגיאה יחסית
\begin{tikzpicture}
  \begin{axis}[ymin=0, legend pos=north west]
    \addplot+[error bars/.cd, y dir=plus, y fixed=0.4]
      coordinates {(1,2) (2,3) (3,3.5) (4,4.4)};
    \addplot+[error bars/.cd, y dir=both, y fixed relative=0.1]
      coordinates {(1,1) (2,1.6) (3,2.2) (4,2.5)};
    \legend{fixed $\pm 0.4$ (upper), relative 10\%}
  \end{axis}
\end{tikzpicture}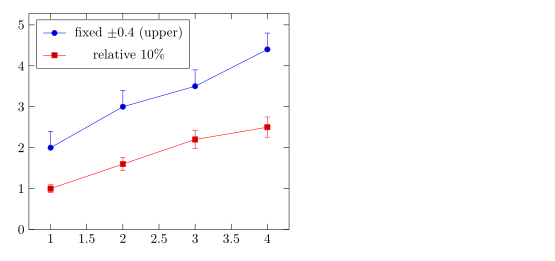
שגיאות שונות למעלה ולמטה
כותבים += (0, up) לשגיאה העליונה ו--= (0, down) לתחתונה.
שגיאות אסימטריות
\begin{tikzpicture}
  \begin{axis}[width=7cm, height=5cm, xmin=0.5, xmax=3.5]
    \addplot+[only marks, error bars/.cd, y dir=both, y explicit]
      coordinates {
        (1,2.0) += (0,0.5) -= (0,0.1)
        (2,3.0) += (0,0.2) -= (0,0.6)
        (3,2.6) += (0,0.3) -= (0,0.3)
      };
  \end{axis}
\end{tikzpicture}
שגיאות ב-x וב-y
מפעילים את שני הכיוונים עם x dir ו-y dir. error bar style מעצב את הקווים.
קווי שגיאה בשני הכיוונים
\begin{tikzpicture}
  \begin{axis}[xlabel=$x$, ylabel=$y$]
    \addplot+[only marks, mark=square*,
              error bars/.cd,
                x dir=both, x explicit,
                y dir=both, y explicit,
                error bar style={red, thick}]
      coordinates {
        (1.0,1.2) +- (0.15,0.20)
        (2.0,2.1) +- (0.20,0.15)
        (3.0,2.8) +- (0.10,0.30)
      };
  \end{axis}
\end{tikzpicture}
רצועות שגיאה עם fill between
לאי-ודאות רציפה, מצללים את השטח בין עקומה עליונה לעקומה תחתונה. טוענים את הספרייה fillbetween, נותנים שם לשתי העקומות עם name path וממלאים ביניהן.
רצועה מוצללת סביב עקומה
\documentclass{article}
\usepackage{pgfplots}
\usepgfplotslibrary{fillbetween}
\begin{document}
\begin{tikzpicture}
  \begin{axis}[domain=0:4, samples=40, xlabel=$t$, ylabel=$y$]
    \addplot[name path=upper, draw=none] {exp(-0.5*x) + 0.1 + 0.05*x};
    \addplot[name path=lower, draw=none] {exp(-0.5*x) - 0.1 - 0.05*x};
    \addplot[blue!20] fill between[of=upper and lower];
    \addplot[blue, thick] {exp(-0.5*x)};
  \end{axis}
\end{tikzpicture}
\end{document}
אפשרויות של קווי שגיאה
| אפשרות | מה היא עושה | ב-Scissor LaTeX |
|---|---|---|
y dir=both, plus, minus, none | איזה חצי של הקו לצייר (גם x dir) | עובד |
y explicit, x explicit | שגיאות מ-+- בקואורדינטות או מעמודה בטבלה | עובד |
y error=col, x error=col, y error index=n | עמודת הטבלה עם השגיאות | עובד |
+= (ex,ey), -= (ex,ey) | שגיאות עליונות ותחתונות נפרדות בקואורדינטות | עובד |
y fixed=v, y fixed relative=r | אותה שגיאה לכל נקודה | עובד |
error bar style={..} | צבע ועובי קו של הקווים | עובד |
error mark=.., error mark options={..} | הכובע בכל קצה | מתקבל, אבל הכובע תמיד קו קצר |
מה שונה מהתקנת TeX
מדריך pgfplots מתאר קווי שגיאה בפרק שלו על קווי שגיאה: ctan.org/pkg/pgfplots.
ראו גם גרפי עמודות, גרפי פיזור ונתונים מקובץ CSV.
שאלות ותשובות
איך מוסיפים קווי שגיאה ב-pgfplots?
כותבים \addplot+[error bars/.cd, y dir=both, y explicit] coordinates {(1,2) +- (0,0.3) ...};. המספר השני אחרי +- הוא שגיאת ה-y.
איך קוראים קווי שגיאה מקובץ CSV?
מוסיפים y error=column לאפשרויות של הטבלה, יחד עם y explicit באפשרויות של קווי השגיאה: table[x=a, y=b, y error=c, col sep=comma] {file.csv}.
אפשר שקווי השגיאה יהיו שונים למעלה ולמטה?
כן. כותבים += (0, up) ו--= (0, down) אחרי הנקודה במקום +-, כמו ב-(1,2) += (0,0.5) -= (0,0.1).
כל דוגמה בדף הזה מסודרת על ידי Scissor LaTeX בזמן בניית האתר. עודכן לאחרונה: 2026-11-07.