


pgfplots से एरर बार
\addplot के ऑप्शन में error bars/.cd, y dir=both, y explicit जोड़ें और हर एरर को उसके पॉइंट के बाद +- (0, error) के रूप में लिखें, या y error= से एरर किसी टेबल कॉलम से पढ़ें।
पॉइंट के साथ लिखे एरर
एरर बार हर \addplot पर अलग से चालू किए जाते हैं। error bars/.cd के बाद की keys बताती हैं कि उन्हें किस दिशा में ड्रॉ करना है और वैल्यू कहाँ से आती हैं। y explicit के साथ हर पॉइंट +- के बाद अपना एरर साथ रखता है।
कोऑर्डिनेट से सममित y एरर
\begin{tikzpicture}
  \begin{axis}[xlabel={Length (m)}, ylabel={Period (s)}]
    \addplot+[error bars/.cd, y dir=both, y explicit]
      coordinates {
        (0.2,0.90) +- (0,0.05)
        (0.4,1.27) +- (0,0.04)
        (0.6,1.55) +- (0,0.06)
        (0.8,1.80) +- (0,0.05)
        (1.0,2.01) +- (0,0.07)
      };
  \end{axis}
\end{tikzpicture}
+- (ex, ey) में पहला नंबर x एरर है और दूसरा y एरर। सिर्फ़ वही दिशाएँ ड्रॉ होती हैं जिन्हें आप चालू करते हैं।
टेबल कॉलम से एरर
जब डेटा टेबल हो, तो y error= से एरर वाले कॉलम का नाम दें। फ़ाइल के साथ भी यही काम करता है, जैसे table[x=t, y=v, y error=dv, col sep=comma] {data.csv}।
एक कॉलम से पढ़े गए y एरर
\begin{tikzpicture}
  \begin{axis}[xlabel={Dose}, ylabel={Response}, ymin=0]
    \addplot+[only marks, error bars/.cd, y dir=both, y explicit]
      table[x=dose, y=mean, y error=sd] {
        dose mean sd
        1    2.1  0.3
        2    3.4  0.4
        4    5.0  0.6
        8    6.2  0.5
      };
  \end{axis}
\end{tikzpicture}
एक तरफ़ा और फ़िक्स्ड एरर
y dir=plus या y dir=minus सिर्फ़ ऊपरी या निचला आधा हिस्सा ड्रॉ करता है। अलग-अलग वैल्यू की जगह y fixed=0.2 हर पॉइंट को एक ही एरर देता है, और y fixed relative=0.1 उसकी वैल्यू के 10% का एरर।
सिर्फ़ ऊपरी एरर, और एक सापेक्ष एरर
\begin{tikzpicture}
  \begin{axis}[ymin=0, legend pos=north west]
    \addplot+[error bars/.cd, y dir=plus, y fixed=0.4]
      coordinates {(1,2) (2,3) (3,3.5) (4,4.4)};
    \addplot+[error bars/.cd, y dir=both, y fixed relative=0.1]
      coordinates {(1,1) (2,1.6) (3,2.2) (4,2.5)};
    \legend{fixed $\pm 0.4$ (upper), relative 10\%}
  \end{axis}
\end{tikzpicture}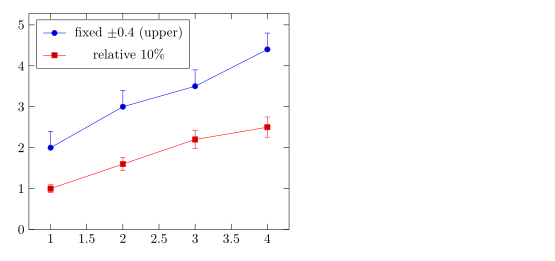
ऊपर और नीचे अलग एरर
ऊपरी एरर के लिए += (0, up) और निचले के लिए -= (0, down) लिखें।
असममित एरर
\begin{tikzpicture}
  \begin{axis}[width=7cm, height=5cm, xmin=0.5, xmax=3.5]
    \addplot+[only marks, error bars/.cd, y dir=both, y explicit]
      coordinates {
        (1,2.0) += (0,0.5) -= (0,0.1)
        (2,3.0) += (0,0.2) -= (0,0.6)
        (3,2.6) += (0,0.3) -= (0,0.3)
      };
  \end{axis}
\end{tikzpicture}
x और y में एरर
x dir और y dir से दोनों दिशाएँ चालू करें। error bar style बार को स्टाइल देता है।
दोनों दिशाओं में एरर बार
\begin{tikzpicture}
  \begin{axis}[xlabel=$x$, ylabel=$y$]
    \addplot+[only marks, mark=square*,
              error bars/.cd,
                x dir=both, x explicit,
                y dir=both, y explicit,
                error bar style={red, thick}]
      coordinates {
        (1.0,1.2) +- (0.15,0.20)
        (2.0,2.1) +- (0.20,0.15)
        (3.0,2.8) +- (0.10,0.30)
      };
  \end{axis}
\end{tikzpicture}
fill between से एरर बैंड
लगातार अनिश्चितता के लिए ऊपरी और निचले कर्व के बीच का हिस्सा शेड करें। fillbetween लाइब्रेरी लोड करें, दोनों कर्व को name path से नाम दें, और उनके बीच फ़िल करें।
एक कर्व के चारों ओर शेड किया गया बैंड
\documentclass{article}
\usepackage{pgfplots}
\usepgfplotslibrary{fillbetween}
\begin{document}
\begin{tikzpicture}
  \begin{axis}[domain=0:4, samples=40, xlabel=$t$, ylabel=$y$]
    \addplot[name path=upper, draw=none] {exp(-0.5*x) + 0.1 + 0.05*x};
    \addplot[name path=lower, draw=none] {exp(-0.5*x) - 0.1 - 0.05*x};
    \addplot[blue!20] fill between[of=upper and lower];
    \addplot[blue, thick] {exp(-0.5*x)};
  \end{axis}
\end{tikzpicture}
\end{document}
एरर बार के ऑप्शन
| ऑप्शन | क्या करता है | Scissor LaTeX में |
|---|---|---|
y dir=both, plus, minus, none | बार का कौन-सा आधा हिस्सा ड्रॉ करना है (x dir भी) | काम करता है |
y explicit, x explicit | कोऑर्डिनेट में +- से या टेबल कॉलम से एरर | काम करता है |
y error=col, x error=col, y error index=n | एरर वाला टेबल कॉलम | काम करता है |
+= (ex,ey), -= (ex,ey) | कोऑर्डिनेट में अलग ऊपरी और निचले एरर | काम करता है |
y fixed=v, y fixed relative=r | हर पॉइंट के लिए एक ही एरर | काम करता है |
error bar style={..} | बार का रंग और लाइन की मोटाई | काम करता है |
error mark=.., error mark options={..} | हर सिरे पर कैप | स्वीकार किया जाता है, पर कैप हमेशा एक छोटी लाइन होती है |
TeX इंस्टॉलेशन से क्या अलग है
pgfplots मैनुअल अपने एरर बार वाले सेक्शन में इनके बारे में बताता है: ctan.org/pkg/pgfplots।
यह भी देखें: बार चार्ट, स्कैटर प्लॉट और CSV से डेटा।
सवाल और जवाब
pgfplots में एरर बार कैसे जोड़ें?
\addplot+[error bars/.cd, y dir=both, y explicit] coordinates {(1,2) +- (0,0.3) ...}; लिखें। +- के बाद का दूसरा नंबर y एरर है।
CSV फ़ाइल से एरर बार कैसे पढ़ें?
टेबल के ऑप्शन में y error=column जोड़ें, और एरर बार के ऑप्शन में y explicit भी: table[x=a, y=b, y error=c, col sep=comma] {file.csv}।
क्या एरर बार ऊपर और नीचे अलग हो सकते हैं?
हाँ। पॉइंट के बाद +- की जगह += (0, up) और -= (0, down) लिखें, जैसे (1,2) += (0,0.5) -= (0,0.1)।
इस पेज का हर उदाहरण साइट बनते समय Scissor LaTeX टाइपसेट करता है। पिछला अपडेट: 2026-11-07।