


pgfplots로 오차 막대 그리기
\addplot 옵션에 error bars/.cd, y dir=both, y explicit를 넣고 각 점 뒤에 +- (0, error)로 오차를 쓰거나, y error=로 표의 열에서 오차를 읽으세요.
점과 함께 쓴 오차
오차 막대는 \addplot마다 켭니다. error bars/.cd 뒤의 키는 어느 방향으로 그릴지, 값을 어디서 가져올지를 정합니다. y explicit를 쓰면 각 점이 +- 뒤에 자기 오차를 갖습니다.
좌표에서 읽은 대칭 y 오차
\begin{tikzpicture}
  \begin{axis}[xlabel={Length (m)}, ylabel={Period (s)}]
    \addplot+[error bars/.cd, y dir=both, y explicit]
      coordinates {
        (0.2,0.90) +- (0,0.05)
        (0.4,1.27) +- (0,0.04)
        (0.6,1.55) +- (0,0.06)
        (0.8,1.80) +- (0,0.05)
        (1.0,2.01) +- (0,0.07)
      };
  \end{axis}
\end{tikzpicture}
+- (ex, ey)에서 첫 번째 숫자는 x 오차, 두 번째 숫자는 y 오차입니다. 켠 방향만 그려집니다.
표 열에서 읽은 오차
데이터가 표라면 y error=로 오차 열의 이름을 지정하세요. 파일에서도 똑같이 작동합니다. 예: table[x=t, y=v, y error=dv, col sep=comma] {data.csv}.
열에서 읽은 y 오차
\begin{tikzpicture}
  \begin{axis}[xlabel={Dose}, ylabel={Response}, ymin=0]
    \addplot+[only marks, error bars/.cd, y dir=both, y explicit]
      table[x=dose, y=mean, y error=sd] {
        dose mean sd
        1    2.1  0.3
        2    3.4  0.4
        4    5.0  0.6
        8    6.2  0.5
      };
  \end{axis}
\end{tikzpicture}
한쪽 오차와 고정 오차
y dir=plus나 y dir=minus는 위쪽이나 아래쪽 절반만 그립니다. 값을 일일이 적는 대신 y fixed=0.2는 모든 점에 같은 오차를, y fixed relative=0.1은 값의 10%만큼의 오차를 줍니다.
위쪽 오차만, 그리고 상대 오차
\begin{tikzpicture}
  \begin{axis}[ymin=0, legend pos=north west]
    \addplot+[error bars/.cd, y dir=plus, y fixed=0.4]
      coordinates {(1,2) (2,3) (3,3.5) (4,4.4)};
    \addplot+[error bars/.cd, y dir=both, y fixed relative=0.1]
      coordinates {(1,1) (2,1.6) (3,2.2) (4,2.5)};
    \legend{fixed $\pm 0.4$ (upper), relative 10\%}
  \end{axis}
\end{tikzpicture}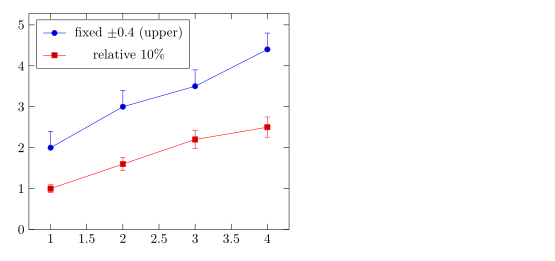
위아래가 다른 오차
위쪽 오차는 += (0, up), 아래쪽 오차는 -= (0, down)으로 쓰세요.
비대칭 오차
\begin{tikzpicture}
  \begin{axis}[width=7cm, height=5cm, xmin=0.5, xmax=3.5]
    \addplot+[only marks, error bars/.cd, y dir=both, y explicit]
      coordinates {
        (1,2.0) += (0,0.5) -= (0,0.1)
        (2,3.0) += (0,0.2) -= (0,0.6)
        (3,2.6) += (0,0.3) -= (0,0.3)
      };
  \end{axis}
\end{tikzpicture}
x와 y 방향 오차
x dir와 y dir로 두 방향을 모두 켜세요. error bar style은 막대의 스타일을 정합니다.
두 방향의 오차 막대
\begin{tikzpicture}
  \begin{axis}[xlabel=$x$, ylabel=$y$]
    \addplot+[only marks, mark=square*,
              error bars/.cd,
                x dir=both, x explicit,
                y dir=both, y explicit,
                error bar style={red, thick}]
      coordinates {
        (1.0,1.2) +- (0.15,0.20)
        (2.0,2.1) +- (0.20,0.15)
        (3.0,2.8) +- (0.10,0.30)
      };
  \end{axis}
\end{tikzpicture}
fill between으로 그리는 오차 띠
연속적인 불확도는 위쪽 곡선과 아래쪽 곡선 사이를 칠해서 나타냅니다. fillbetween 라이브러리를 불러오고, 두 곡선에 name path로 이름을 붙인 다음 그 사이를 채우세요.
곡선 주위에 칠한 띠
\documentclass{article}
\usepackage{pgfplots}
\usepgfplotslibrary{fillbetween}
\begin{document}
\begin{tikzpicture}
  \begin{axis}[domain=0:4, samples=40, xlabel=$t$, ylabel=$y$]
    \addplot[name path=upper, draw=none] {exp(-0.5*x) + 0.1 + 0.05*x};
    \addplot[name path=lower, draw=none] {exp(-0.5*x) - 0.1 - 0.05*x};
    \addplot[blue!20] fill between[of=upper and lower];
    \addplot[blue, thick] {exp(-0.5*x)};
  \end{axis}
\end{tikzpicture}
\end{document}
오차 막대 옵션
| 옵션 | 하는 일 | Scissor LaTeX에서 |
|---|---|---|
y dir=both, plus, minus, none | 막대의 어느 쪽을 그릴지(x dir도 같음) | 작동함 |
y explicit, x explicit | 좌표의 +-나 표 열에서 읽은 오차 | 작동함 |
y error=col, x error=col, y error index=n | 오차가 담긴 표 열 | 작동함 |
+= (ex,ey), -= (ex,ey) | 좌표에 따로 적은 위쪽·아래쪽 오차 | 작동함 |
y fixed=v, y fixed relative=r | 모든 점에 같은 오차 | 작동함 |
error bar style={..} | 막대의 색과 선 굵기 | 작동함 |
error mark=.., error mark options={..} | 양 끝의 가로선(캡) | 받아들이지만 캡은 항상 짧은 선 |
TeX 설치 환경과 다른 점
pgfplots 설명서의 오차 막대 절에 자세한 설명이 있습니다: ctan.org/pkg/pgfplots.
질문과 답변
pgfplots에서 오차 막대는 어떻게 넣나요?
\addplot+[error bars/.cd, y dir=both, y explicit] coordinates {(1,2) +- (0,0.3) ...};처럼 쓰세요. +- 뒤의 두 번째 숫자가 y 오차입니다.
CSV 파일에서 오차 막대를 읽으려면 어떻게 하나요?
표 옵션에 y error=column을 넣고, 오차 막대 옵션에는 y explicit를 함께 넣으세요. table[x=a, y=b, y error=c, col sep=comma] {file.csv}처럼 씁니다.
오차 막대의 위아래 길이를 다르게 할 수 있나요?
네. 점 뒤에 +- 대신 += (0, up)과 -= (0, down)을 쓰세요. (1,2) += (0,0.5) -= (0,0.1)처럼 씁니다.
이 페이지의 모든 예제는 사이트를 빌드할 때 Scissor LaTeX로 조판됩니다. 마지막 업데이트: 2026-11-07