


用 pgfplots 绘制误差棒
在 \addplot 的选项中加 error bars/.cd, y dir=both, y explicit,并在每个点后面写 +- (0, error) 给出误差,或用 y error= 从表格的某一列读取误差。
与点一起写出的误差
误差棒按 \addplot 分别开启。error bars/.cd 之后的键说明在哪个方向绘制,以及数值从哪里来。使用 y explicit 时,每个点在 +- 后面带上自己的误差。
来自坐标的对称 y 误差
\begin{tikzpicture}
  \begin{axis}[xlabel={Length (m)}, ylabel={Period (s)}]
    \addplot+[error bars/.cd, y dir=both, y explicit]
      coordinates {
        (0.2,0.90) +- (0,0.05)
        (0.4,1.27) +- (0,0.04)
        (0.6,1.55) +- (0,0.06)
        (0.8,1.80) +- (0,0.05)
        (1.0,2.01) +- (0,0.07)
      };
  \end{axis}
\end{tikzpicture}
在 +- (ex, ey) 中,第一个数是 x 误差,第二个数是 y 误差。只有你开启的方向才会绘制。
来自表格列的误差
数据是表格时,用 y error= 指定误差所在的列。文件也同样适用,例如 table[x=t, y=v, y error=dv, col sep=comma] {data.csv}。
从某一列读取的 y 误差
\begin{tikzpicture}
  \begin{axis}[xlabel={Dose}, ylabel={Response}, ymin=0]
    \addplot+[only marks, error bars/.cd, y dir=both, y explicit]
      table[x=dose, y=mean, y error=sd] {
        dose mean sd
        1    2.1  0.3
        2    3.4  0.4
        4    5.0  0.6
        8    6.2  0.5
      };
  \end{axis}
\end{tikzpicture}
单侧误差和固定误差
y dir=plus 或 y dir=minus 只绘制上半部分或下半部分。不给出具体数值时,y fixed=0.2 让每个点都有相同的误差,y fixed relative=0.1 则给出其数值 10% 的误差。
只有上方误差,以及相对误差
\begin{tikzpicture}
  \begin{axis}[ymin=0, legend pos=north west]
    \addplot+[error bars/.cd, y dir=plus, y fixed=0.4]
      coordinates {(1,2) (2,3) (3,3.5) (4,4.4)};
    \addplot+[error bars/.cd, y dir=both, y fixed relative=0.1]
      coordinates {(1,1) (2,1.6) (3,2.2) (4,2.5)};
    \legend{fixed $\pm 0.4$ (upper), relative 10\%}
  \end{axis}
\end{tikzpicture}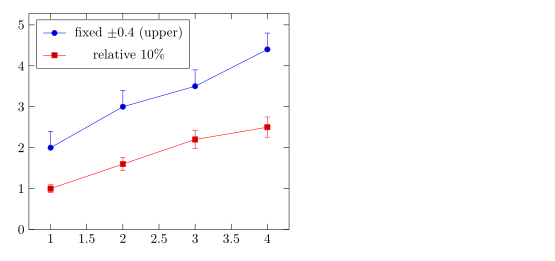
上下不同的误差
用 += (0, up) 写上方误差,用 -= (0, down) 写下方误差。
非对称误差
\begin{tikzpicture}
  \begin{axis}[width=7cm, height=5cm, xmin=0.5, xmax=3.5]
    \addplot+[only marks, error bars/.cd, y dir=both, y explicit]
      coordinates {
        (1,2.0) += (0,0.5) -= (0,0.1)
        (2,3.0) += (0,0.2) -= (0,0.6)
        (3,2.6) += (0,0.3) -= (0,0.3)
      };
  \end{axis}
\end{tikzpicture}
x 和 y 方向的误差
用 x dir 和 y dir 同时开启两个方向。error bar style 设置误差棒的样式。
两个方向的误差棒
\begin{tikzpicture}
  \begin{axis}[xlabel=$x$, ylabel=$y$]
    \addplot+[only marks, mark=square*,
              error bars/.cd,
                x dir=both, x explicit,
                y dir=both, y explicit,
                error bar style={red, thick}]
      coordinates {
        (1.0,1.2) +- (0.15,0.20)
        (2.0,2.1) +- (0.20,0.15)
        (3.0,2.8) +- (0.10,0.30)
      };
  \end{axis}
\end{tikzpicture}
用 fill between 绘制误差带
对于连续的不确定度,可以给上下两条曲线之间的区域着色。加载 fillbetween 库,用 name path 给两条曲线命名,然后填充它们之间的区域。
曲线周围的着色带
\documentclass{article}
\usepackage{pgfplots}
\usepgfplotslibrary{fillbetween}
\begin{document}
\begin{tikzpicture}
  \begin{axis}[domain=0:4, samples=40, xlabel=$t$, ylabel=$y$]
    \addplot[name path=upper, draw=none] {exp(-0.5*x) + 0.1 + 0.05*x};
    \addplot[name path=lower, draw=none] {exp(-0.5*x) - 0.1 - 0.05*x};
    \addplot[blue!20] fill between[of=upper and lower];
    \addplot[blue, thick] {exp(-0.5*x)};
  \end{axis}
\end{tikzpicture}
\end{document}
误差棒选项
| 选项 | 作用 | 在 Scissor LaTeX 中 |
|---|---|---|
y dir=both、plus、minus、none | 绘制误差棒的哪一半(x dir 同理) | 支持 |
y explicit、x explicit | 误差来自坐标中的 +- 或表格的某一列 | 支持 |
y error=col、x error=col、y error index=n | 包含误差的表格列 | 支持 |
+= (ex,ey)、-= (ex,ey) | 在坐标中分别给出上方和下方误差 | 支持 |
y fixed=v、y fixed relative=r | 每个点使用相同的误差 | 支持 |
error bar style={..} | 误差棒的颜色和线宽 | 支持 |
error mark=..、error mark options={..} | 两端的端帽 | 可接受,但端帽总是一条短线 |
与 TeX 发行版的不同之处
pgfplots 手册在介绍误差棒的章节中说明了误差棒:ctan.org/pkg/pgfplots。
另请参阅柱状图、散点图和来自 CSV 的数据。
常见问题
如何在 pgfplots 中添加误差棒?
写 \addplot+[error bars/.cd, y dir=both, y explicit] coordinates {(1,2) +- (0,0.3) ...};。+- 之后的第二个数是 y 误差。
如何从 CSV 文件读取误差棒?
在表格选项中加 y error=column,并在误差棒选项中加 y explicit:table[x=a, y=b, y error=c, col sep=comma] {file.csv}。
误差棒可以上下不同吗?
可以。在点后面用 += (0, up) 和 -= (0, down) 代替 +-,例如 (1,2) += (0,0.5) -= (0,0.1)。
本页的每个示例都在构建网站时由 Scissor LaTeX 排版。 最后更新:2026-11-07