


等高線圖、熱度圖與色彩對應表
在設定了 view={0}{90} 的座標軸中使用 \addplot3:熱度圖用 surf 或 matrix plot,填色等高線用 contour filled,再加上 colorbar 和 colormap 顯示色階。
函數的熱度圖
\addplot3 繪製 x 和 y 的函數。從正上方觀看(view={0}{90})時,surf 圖會變成熱度圖:每個格子依其數值透過色彩對應表上色。shader=interp 讓顏色平滑漸變;shader=flat 則讓每個格子只有一種顏色。
附色條的平滑熱度圖
\begin{tikzpicture}
  \begin{axis}[view={0}{90}, colorbar, colormap/viridis,
               xlabel=$x$, ylabel=$y$, enlargelimits=false]
    \addplot3[surf, shader=interp, domain=-2:2, y domain=-2:2, samples=30]
      {exp(-x^2 - y^2) * (1 + x)};
  \end{axis}
\end{tikzpicture}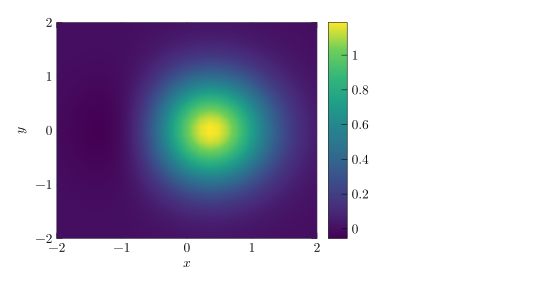
domain 設定 x 的範圍,y domain 設定 y 的範圍,samples 設定網格大小(預設 25;要在 y 方向使用不同的點數,請用 samples y)。
填色等高線
contour filled 把數值分成幾個區帶。number= 設定等高線的層數;levels={...} 則讓你自己列出各層。
雙峰函數的填色等高線
\begin{tikzpicture}
  \begin{axis}[view={0}{90}, colorbar, colormap/hot, enlargelimits=false]
    \addplot3[contour filled={number=8}, domain=-3:3, y domain=-3:3, samples=40]
      {exp(-(x-1)^2 - y^2) + 0.7*exp(-(x+1.2)^2 - (y-1)^2)};
  \end{axis}
\end{tikzpicture}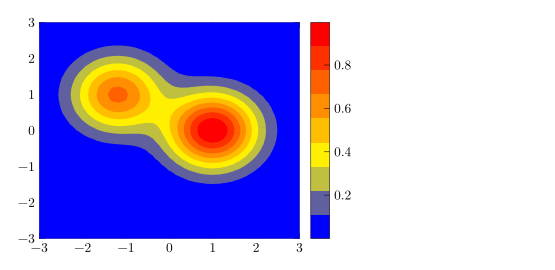
從表格繪製熱度圖:matrix plot
對於網格上的量測資料,matrix plot* 會為表格的每一列畫一個格子。mesh/cols 指定網格有幾欄,point meta=explicit 搭配 meta= 則指定數值欄位。
3 × 3 的數值網格
\begin{tikzpicture}
  \begin{axis}[colorbar, colormap/bluered, enlargelimits=false,
               xtick=data, ytick=data, width=6.5cm, height=6cm]
    \addplot[matrix plot*, mesh/cols=3, point meta=explicit]
      table[meta=v] {
        x y v
        0 0 1
        1 0 4
        2 0 2
        0 1 3
        1 1 9
        2 1 5
        0 2 2
        1 2 6
        2 2 44
      };
  \end{axis}
\end{tikzpicture}
等高線
不填色的等高線需要替你計算等高線層。在 pgfplots 中,這是 contour gnuplot 或 contour lua,在 TeX 安裝環境中需要額外的程式或 LuaLaTeX。Scissor LaTeX 會自己計算並畫出這些線,並在「問題」分頁中提醒你這段程式碼在其他地方可能無法編譯。
用 contour gnuplot 繪製等高線
\begin{tikzpicture}
  \begin{axis}[view={0}{90}, xlabel=$x$, ylabel=$y$]
    \addplot3[contour gnuplot={levels={0.2, 0.5, 0.8}},
              domain=-2:2, y domain=-2:2, samples=30]
      {exp(-x^2 - y^2)};
  \end{axis}
\end{tikzpicture}
「問題」分頁: contour gnuplot needs gnuplot and shell escape in LaTeX; contour filled or contour prepared compile everywhere
如果檔案需要在各處都能編譯,請使用 contour filled,或搭配預先計算好的等高線資料使用 contour prepared。
色彩對應表與色條
| 選項 | 作用 | 在 Scissor LaTeX 中 |
|---|---|---|
colormap/viridis、/hot、/cool、/jet、/blackwhite、/bluered | 內建的色彩對應表 | 可以使用 |
colormap name=viridis | 依名稱選擇對應表 | 可以使用 |
colormap={name}{rgb255=(..) rgb255=(..)} | 自訂的對應表 | 可以使用 |
colorbar、colorbar horizontal | 圖表旁邊或下方的色階 | 可以使用 |
colorbar style={..} | 色條的刻度和標籤 | 可以使用 |
point meta min、point meta max | 固定顏色範圍 | 可以使用 |
shader=flat、shader=interp、shader=faceted | 格子的上色方式 | 可以使用 |
自訂色彩對應表與水平色條
\begin{tikzpicture}
  \begin{axis}[view={0}{90}, enlargelimits=false,
               colormap={sea}{rgb255=(255,255,255) rgb255=(120,180,220) rgb255=(10,40,100)},
               colorbar horizontal, width=7cm, height=6cm]
    \addplot3[surf, shader=flat, domain=0:2, y domain=0:2, samples=12] {x*y};
  \end{axis}
\end{tikzpicture}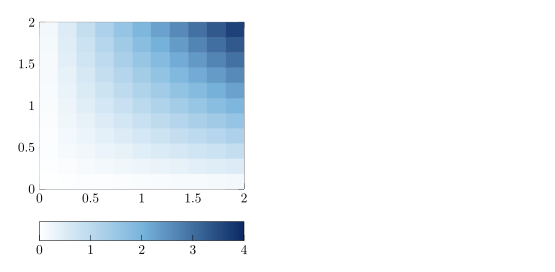
3D 視角
Scissor LaTeX 只會以從正上方觀看的方式繪製 \addplot3。其他任何 view,包括預設的 3D 視角,都會讓座標軸保持空白並顯示訊息。
不會繪製的 3D 視角
\begin{tikzpicture}
  \begin{axis}[width=6cm, height=5cm]
    \addplot3[surf, domain=-2:2, y domain=-2:2] {x^2 - y^2};
  \end{axis}
\end{tikzpicture}
「問題」分頁: 3D plots are drawn only when seen from above (view={0}{90}) for now
與 TeX 安裝環境的差異
pgfplots 手冊詳細說明了 \addplot3、色彩對應表和等高線:ctan.org/pkg/pgfplots。
另請參閱 pgfplots 基礎、對數座標軸和 pgfplots。
常見問題
怎麼在 LaTeX 中製作熱度圖?
在設定了 view={0}{90} 的座標軸中使用 \addplot3[surf, shader=interp] {f(x,y)};(表格資料則用 matrix plot*),並加上 colorbar。
Scissor LaTeX 會繪製 3D 曲面圖嗎?
目前還不會。\addplot3 只有在從正上方觀看時(view={0}{90})才會繪製;其他視角會讓座標軸保持空白,「問題」分頁會說明這一點。
為什麼 contour gnuplot 會顯示警告?
在 TeX 安裝環境中,它需要 gnuplot 和 shell escape。Scissor LaTeX 仍會畫出等高線,但會警告這段程式碼在其他地方可能無法編譯。contour filled 則在各處都能編譯。
本頁的每個範例都在建置網站時由 Scissor LaTeX 排版。 最後更新:2026-11-07