


कंटूर, हीट मैप और कलर मैप
view={0}{90} वाले ऐक्सिस में \addplot3 इस्तेमाल करें: हीट मैप के लिए surf या matrix plot, भरे कंटूर के लिए contour filled, और स्केल के लिए colorbar और एक colormap जोड़ें।
किसी फ़ंक्शन का हीट मैप
\addplot3 x और y के फ़ंक्शन को प्लॉट करता है। ऊपर से देखने पर (view={0}{90}), surf प्लॉट एक हीट मैप बन जाता है: हर सेल को कलर मैप के ज़रिए उसकी वैल्यू के हिसाब से रंग मिलता है। shader=interp रंगों को स्मूद तरीके से मिलाता है; shader=flat हर सेल को एक रंग देता है।
कलर बार के साथ एक स्मूद हीट मैप
\begin{tikzpicture}
  \begin{axis}[view={0}{90}, colorbar, colormap/viridis,
               xlabel=$x$, ylabel=$y$, enlargelimits=false]
    \addplot3[surf, shader=interp, domain=-2:2, y domain=-2:2, samples=30]
      {exp(-x^2 - y^2) * (1 + x)};
  \end{axis}
\end{tikzpicture}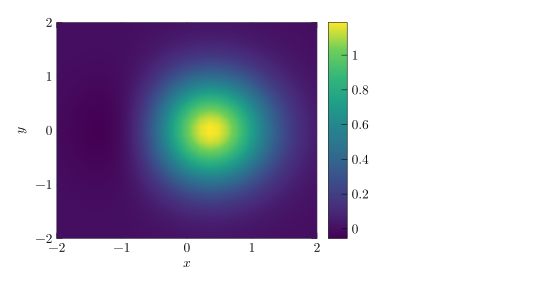
domain x की रेंज तय करता है, y domain y की रेंज, और samples ग्रिड का साइज़ (डिफ़ॉल्ट 25, y में अलग गिनती के लिए samples y)।
भरे हुए कंटूर
contour filled वैल्यू को पट्टियों में बाँटता है। number= तय करता है कि कितने कंटूर लेवल हों; levels={...} से आप उन्हें खुद लिखते हैं।
दो चोटी वाले फ़ंक्शन के भरे कंटूर
\begin{tikzpicture}
  \begin{axis}[view={0}{90}, colorbar, colormap/hot, enlargelimits=false]
    \addplot3[contour filled={number=8}, domain=-3:3, y domain=-3:3, samples=40]
      {exp(-(x-1)^2 - y^2) + 0.7*exp(-(x+1.2)^2 - (y-1)^2)};
  \end{axis}
\end{tikzpicture}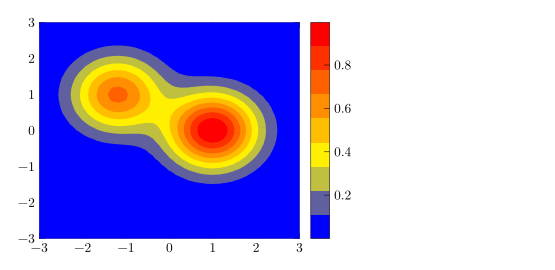
टेबल से हीट मैप: matrix plot
ग्रिड पर मापे गए डेटा के लिए matrix plot* टेबल की हर पंक्ति के लिए एक सेल ड्रॉ करता है। mesh/cols बताता है कि ग्रिड में कितने कॉलम हैं, और meta= के साथ point meta=explicit वैल्यू वाले कॉलम का नाम देता है।
वैल्यू का 3 गुणा 3 ग्रिड
\begin{tikzpicture}
  \begin{axis}[colorbar, colormap/bluered, enlargelimits=false,
               xtick=data, ytick=data, width=6.5cm, height=6cm]
    \addplot[matrix plot*, mesh/cols=3, point meta=explicit]
      table[meta=v] {
        x y v
        0 0 1
        1 0 4
        2 0 2
        0 1 3
        1 1 9
        2 1 5
        0 2 2
        1 2 6
        2 2 44
      };
  \end{axis}
\end{tikzpicture}
कंटूर लाइनें
बिना फ़िल वाली लाइनों के लिए कंटूर लेवल आपके लिए गणना किए जाने चाहिए। pgfplots में यह contour gnuplot या contour lua है, जिन्हें TeX इंस्टॉलेशन में अतिरिक्त प्रोग्राम या LuaLaTeX चाहिए। Scissor LaTeX लाइनें खुद गणना करके ड्रॉ करता है, और Problems टैब में याद दिलाता है कि कोड दूसरी जगहों पर शायद कंपाइल न हो।
contour gnuplot से कंटूर लाइनें
\begin{tikzpicture}
  \begin{axis}[view={0}{90}, xlabel=$x$, ylabel=$y$]
    \addplot3[contour gnuplot={levels={0.2, 0.5, 0.8}},
              domain=-2:2, y domain=-2:2, samples=30]
      {exp(-x^2 - y^2)};
  \end{axis}
\end{tikzpicture}
समस्याएँ टैब: contour gnuplot needs gnuplot and shell escape in LaTeX; contour filled or contour prepared compile everywhere
हर जगह कंपाइल होने वाली फ़ाइल के लिए contour filled इस्तेमाल करें, या पहले से गणना किए कंटूर डेटा के साथ contour prepared।
कलर मैप और कलर बार
| ऑप्शन | क्या करता है | Scissor LaTeX में |
|---|---|---|
colormap/viridis, /hot, /cool, /jet, /blackwhite, /bluered | बिल्ट-इन कलर मैप | काम करता है |
colormap name=viridis | नाम से मैप चुनना | काम करता है |
colormap={name}{rgb255=(..) rgb255=(..)} | आपका अपना मैप | काम करता है |
colorbar, colorbar horizontal | प्लॉट के बगल में या नीचे एक स्केल | काम करता है |
colorbar style={..} | कलर बार के टिक और लेबल | काम करता है |
point meta min, point meta max | रंगों की रेंज तय करना | काम करता है |
shader=flat, shader=interp, shader=faceted | सेल कैसे रंगे जाते हैं | काम करता है |
कस्टम कलर मैप और आड़ा कलर बार
\begin{tikzpicture}
  \begin{axis}[view={0}{90}, enlargelimits=false,
               colormap={sea}{rgb255=(255,255,255) rgb255=(120,180,220) rgb255=(10,40,100)},
               colorbar horizontal, width=7cm, height=6cm]
    \addplot3[surf, shader=flat, domain=0:2, y domain=0:2, samples=12] {x*y};
  \end{axis}
\end{tikzpicture}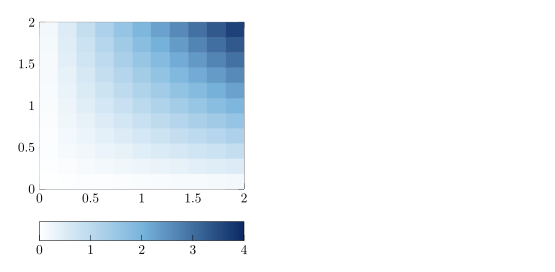
3D व्यू
Scissor LaTeX \addplot3 को सिर्फ़ सीधे ऊपर से देखे जाने पर ड्रॉ करता है। कोई भी दूसरा view, डिफ़ॉल्ट 3D व्यू समेत, ऐक्सिस को खाली छोड़ देता है और एक मैसेज दिखाता है।
3D व्यू ड्रॉ नहीं होता
\begin{tikzpicture}
  \begin{axis}[width=6cm, height=5cm]
    \addplot3[surf, domain=-2:2, y domain=-2:2] {x^2 - y^2};
  \end{axis}
\end{tikzpicture}
समस्याएँ टैब: 3D plots are drawn only when seen from above (view={0}{90}) for now
TeX इंस्टॉलेशन से क्या अलग है
pgfplots मैनुअल \addplot3, कलर मैप और कंटूर को विस्तार से बताता है: ctan.org/pkg/pgfplots।
यह भी देखें: pgfplots की बुनियादी बातें, लॉगरिदमिक ऐक्सिस और pgfplots।
सवाल और जवाब
LaTeX में हीट मैप कैसे बनाएँ?
view={0}{90} वाले ऐक्सिस में \addplot3[surf, shader=interp] {f(x,y)}; (या टेबल डेटा के लिए matrix plot*) इस्तेमाल करें, और colorbar जोड़ें।
क्या Scissor LaTeX 3D सरफ़ेस प्लॉट ड्रॉ करता है?
अभी नहीं। \addplot3 सिर्फ़ ऊपर से देखे जाने पर (view={0}{90}) ड्रॉ होता है; दूसरे व्यू ऐक्सिस को खाली छोड़ते हैं और Problems टैब यह बताता है।
contour gnuplot चेतावनी क्यों दिखाता है?
TeX इंस्टॉलेशन में इसे gnuplot और shell escape चाहिए। Scissor LaTeX फिर भी कंटूर ड्रॉ करता है, पर चेतावनी देता है कि कोड दूसरी जगहों पर शायद कंपाइल न हो। contour filled हर जगह कंपाइल होता है।
इस पेज का हर उदाहरण साइट बनते समय Scissor LaTeX टाइपसेट करता है। पिछला अपडेट: 2026-11-07।