


เส้นชั้นความสูง แผนที่ความร้อน และแผนที่สี
ใช้ \addplot3 ในแกนที่มี view={0}{90} โดยใช้ surf หรือ matrix plot สำหรับแผนที่ความร้อน contour filled สำหรับเส้นชั้นความสูงแบบเติมสี และเพิ่ม colorbar กับ colormap เพื่อแสดงมาตราส่วน
แผนที่ความร้อนของฟังก์ชัน
\addplot3 วาดฟังก์ชันของ x และ y เมื่อมองจากด้านบน (view={0}{90}) กราฟ surf จะกลายเป็นแผนที่ความร้อน แต่ละช่องจะได้สีตามค่าผ่านแผนที่สี shader=interp ผสมสีอย่างต่อเนื่อง ส่วน shader=flat ให้หนึ่งสีต่อหนึ่งช่อง
แผนที่ความร้อนแบบต่อเนื่องพร้อมแถบสี
\begin{tikzpicture}
  \begin{axis}[view={0}{90}, colorbar, colormap/viridis,
               xlabel=$x$, ylabel=$y$, enlargelimits=false]
    \addplot3[surf, shader=interp, domain=-2:2, y domain=-2:2, samples=30]
      {exp(-x^2 - y^2) * (1 + x)};
  \end{axis}
\end{tikzpicture}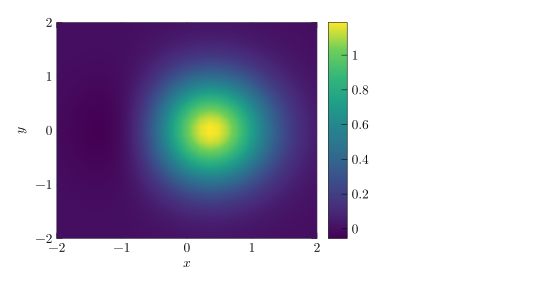
domain กำหนดช่วงของ x, y domain กำหนดช่วงของ y และ samples กำหนดขนาดตาราง (ค่าเริ่มต้น 25 ใช้ samples y หากต้องการจำนวนในแนว y ที่ต่างออกไป)
เส้นชั้นความสูงแบบเติมสี
contour filled แบ่งค่าออกเป็นแถบ number= กำหนดจำนวนระดับของเส้นชั้นความสูง ส่วน levels={...} ให้คุณระบุระดับเอง
เส้นชั้นความสูงแบบเติมสีของฟังก์ชันที่มีสองยอด
\begin{tikzpicture}
  \begin{axis}[view={0}{90}, colorbar, colormap/hot, enlargelimits=false]
    \addplot3[contour filled={number=8}, domain=-3:3, y domain=-3:3, samples=40]
      {exp(-(x-1)^2 - y^2) + 0.7*exp(-(x+1.2)^2 - (y-1)^2)};
  \end{axis}
\end{tikzpicture}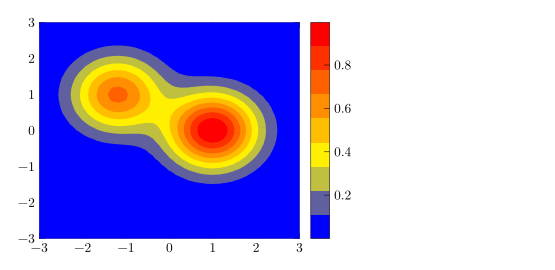
แผนที่ความร้อนจากตาราง: matrix plot
สำหรับข้อมูลที่วัดได้บนตาราง matrix plot* จะวาดหนึ่งช่องต่อหนึ่งแถวของตาราง mesh/cols บอกว่าตารางมีกี่คอลัมน์ และ point meta=explicit ร่วมกับ meta= ระบุคอลัมน์ของค่า
ตารางค่าขนาด 3 x 3
\begin{tikzpicture}
  \begin{axis}[colorbar, colormap/bluered, enlargelimits=false,
               xtick=data, ytick=data, width=6.5cm, height=6cm]
    \addplot[matrix plot*, mesh/cols=3, point meta=explicit]
      table[meta=v] {
        x y v
        0 0 1
        1 0 4
        2 0 2
        0 1 3
        1 1 9
        2 1 5
        0 2 2
        1 2 6
        2 2 44
      };
  \end{axis}
\end{tikzpicture}
เส้นชั้นความสูง
เส้นที่ไม่เติมสีต้องมีการคำนวณระดับของเส้นชั้นความสูงให้ ใน pgfplots คือ contour gnuplot หรือ contour lua ซึ่งในการติดตั้ง TeX ต้องใช้โปรแกรมเพิ่มเติมหรือ LuaLaTeX Scissor LaTeX คำนวณเส้นเองและวาดให้ พร้อมเตือนในแท็บ Problems ว่าโค้ดอาจคอมไพล์ที่อื่นไม่ได้
เส้นชั้นความสูงด้วย contour gnuplot
\begin{tikzpicture}
  \begin{axis}[view={0}{90}, xlabel=$x$, ylabel=$y$]
    \addplot3[contour gnuplot={levels={0.2, 0.5, 0.8}},
              domain=-2:2, y domain=-2:2, samples=30]
      {exp(-x^2 - y^2)};
  \end{axis}
\end{tikzpicture}
แท็บปัญหา: contour gnuplot needs gnuplot and shell escape in LaTeX; contour filled or contour prepared compile everywhere
สำหรับไฟล์ที่คอมไพล์ได้ทุกที่ ให้ใช้ contour filled หรือ contour prepared กับข้อมูลเส้นชั้นความสูงที่คำนวณไว้ล่วงหน้า
แผนที่สีและแถบสี
| ตัวเลือก | ทำอะไร | ใน Scissor LaTeX |
|---|---|---|
colormap/viridis, /hot, /cool, /jet, /blackwhite, /bluered | แผนที่สีที่มีมาให้ | ใช้ได้ |
colormap name=viridis | เลือกแผนที่สีตามชื่อ | ใช้ได้ |
colormap={name}{rgb255=(..) rgb255=(..)} | แผนที่สีของคุณเอง | ใช้ได้ |
colorbar, colorbar horizontal | มาตราส่วนข้างหรือใต้กราฟ | ใช้ได้ |
colorbar style={..} | ขีดแบ่งและป้ายกำกับของแถบสี | ใช้ได้ |
point meta min, point meta max | กำหนดช่วงสีให้คงที่ | ใช้ได้ |
shader=flat, shader=interp, shader=faceted | วิธีระบายสีช่อง | ใช้ได้ |
แผนที่สีแบบกำหนดเองและแถบสีแนวนอน
\begin{tikzpicture}
  \begin{axis}[view={0}{90}, enlargelimits=false,
               colormap={sea}{rgb255=(255,255,255) rgb255=(120,180,220) rgb255=(10,40,100)},
               colorbar horizontal, width=7cm, height=6cm]
    \addplot3[surf, shader=flat, domain=0:2, y domain=0:2, samples=12] {x*y};
  \end{axis}
\end{tikzpicture}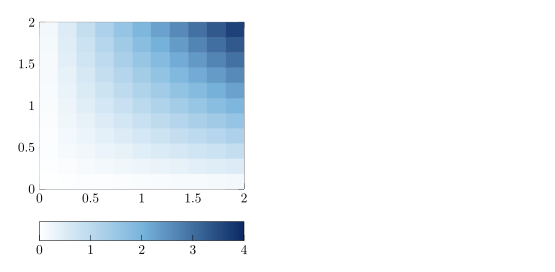
มุมมองสามมิติ
Scissor LaTeX วาด \addplot3 ได้เฉพาะเมื่อมองตรงลงมาจากด้านบน view แบบอื่นใด รวมถึงมุมมองสามมิติเริ่มต้น จะทำให้แกนว่างเปล่าและแสดงข้อความแจ้ง
มุมมองสามมิติจะไม่ถูกวาด
\begin{tikzpicture}
  \begin{axis}[width=6cm, height=5cm]
    \addplot3[surf, domain=-2:2, y domain=-2:2] {x^2 - y^2};
  \end{axis}
\end{tikzpicture}
แท็บปัญหา: 3D plots are drawn only when seen from above (view={0}{90}) for now
สิ่งที่ต่างจากการติดตั้ง TeX
คู่มือ pgfplots อธิบาย \addplot3 แผนที่สี และเส้นชั้นความสูงไว้อย่างละเอียด: ctan.org/pkg/pgfplots
ดูเพิ่มเติม พื้นฐาน pgfplots, แกนลอการิทึม และ pgfplots
คำถามและคำตอบ
จะสร้างแผนที่ความร้อนใน LaTeX ได้อย่างไร
ใช้ \addplot3[surf, shader=interp] {f(x,y)}; (หรือ matrix plot* สำหรับข้อมูลตาราง) ในแกนที่มี view={0}{90} แล้วเพิ่ม colorbar
Scissor LaTeX วาดกราฟพื้นผิวสามมิติได้ไหม
ยังไม่ได้ \addplot3 จะวาดได้เฉพาะเมื่อมองจากด้านบน (view={0}{90}) มุมมองอื่นจะทำให้แกนว่างเปล่า และแท็บ Problems จะแจ้งไว้
ทำไม contour gnuplot จึงแสดงคำเตือน
ในการติดตั้ง TeX ต้องใช้ gnuplot และ shell escape Scissor LaTeX ยังวาดเส้นชั้นความสูงให้ แต่จะเตือนว่าโค้ดอาจคอมไพล์ที่อื่นไม่ได้ ส่วน contour filled คอมไพล์ได้ทุกที่
ทุกตัวอย่างในหน้านี้จัดหน้าโดย Scissor LaTeX ขณะสร้างเว็บไซต์ อัปเดตล่าสุด 2026-11-07