


pgfplots로 선 그래프 그리기
axis 안에 선마다 \addplot을 하나씩 추가하세요. red, dashed, thick, mark=square* 같은 옵션으로 각각 스타일을 정하거나, 순환 목록이 스타일을 고르게 두면 됩니다.
한 축에 여러 선 그리기
\addplot마다 계열이 하나 추가됩니다. 옵션이 없으면 계열들이 순환 목록에서 차례로 스타일을 가져옵니다. \addplot+[...]를 쓰면 그 스타일을 유지한 채 일부만 바꿉니다.
기본 순환 목록에서 스타일을 가져온 세 계열
\begin{tikzpicture}
  \begin{axis}[xlabel=Week, ylabel=Orders, legend pos=north west]
    \addplot coordinates {(1,12) (2,18) (3,25) (4,31) (5,44)};
    \addplot coordinates {(1,10) (2,14) (3,15) (4,21) (5,24)};
    \addplot+[dashed] coordinates {(1,5) (2,9) (3,8) (4,12) (5,13)};
    \legend{Erika, Hans, John}
  \end{axis}
\end{tikzpicture}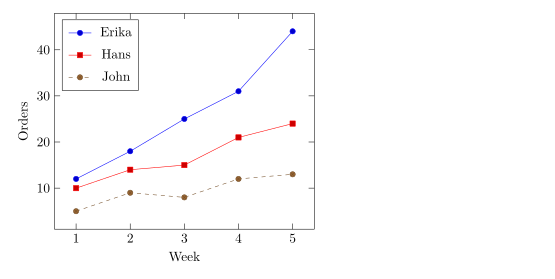
선 스타일과 마커
\addplot 뒤의 옵션으로 색, 선, 마커를 정합니다. 자유롭게 조합할 수 있습니다.
| 옵션 | 값 | Scissor LaTeX에서 |
|---|---|---|
| 색 | red, blue!60!black, color=teal, xcolor의 모든 색 이름이나 혼합색 | 작동함 |
| 선 굵기 | ultra thin, very thin, thin, semithick, thick, very thick, ultra thick, line width=1.5pt | 작동함 |
| 점선 패턴 | solid, dashed, dotted, densely dashed, loosely dotted, dashdotted, dash pattern=on 4pt off 2pt | 작동함 |
mark= | *, o, square*, square, triangle*, triangle, diamond*, diamond, x, +, star, pentagon*, asterisk, otimes*, |, -, none | 작동함 |
mark size=3pt | 마커의 반지름 | 작동함 |
mark options={fill=white} | 마커에만 적용되는 스타일 | 작동함 |
mark repeat=2 | 두 점마다 마커 하나 | 작동함 |
no marks, only marks | 선만, 마커만 | 작동함 |
색, 점선 패턴, 마커
\begin{tikzpicture}
  \begin{axis}[domain=0:4, samples=9, legend pos=outer north east]
    \addplot[blue, thick, mark=*] {x};
    \addplot[red, dashed, mark=square*, mark options={fill=white}] {x^1.5/2};
    \addplot[teal, densely dotted, very thick] {sqrt(x)};
    \addplot[orange, mark=triangle*, mark size=3pt, only marks] {4 - x};
    \legend{linear, power, root, falling}
  \end{axis}
\end{tikzpicture}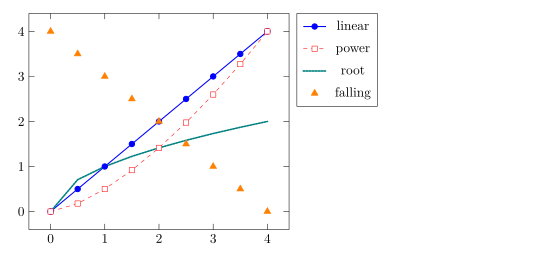
pgfplots와 마찬가지로 마커는 점선 계열에서도 항상 실선으로 그려집니다.
순환 목록 고르기
순환 목록은 옵션 없는 \addplot 명령들이 차례로 쓰는 스타일의 순서입니다. cycle list name으로 내장 목록을 고르거나 cycle list로 직접 만드세요.
black white 순환 목록과 직접 만든 목록
\begin{tikzpicture}
  \begin{axis}[cycle list name=black white, width=6.5cm, height=5cm, title={black white}]
    \addplot coordinates {(0,0) (1,1) (2,4)};
    \addplot coordinates {(0,1) (1,2) (2,2)};
    \addplot coordinates {(0,2) (1,0) (2,1)};
  \end{axis}
\end{tikzpicture}
\begin{tikzpicture}
  \begin{axis}[cycle list={{red, thick}, {blue, dashed}}, width=6.5cm, height=5cm, title={custom}]
    \addplot coordinates {(0,0) (1,1) (2,4)};
    \addplot coordinates {(0,1) (1,2) (2,2)};
  \end{axis}
\end{tikzpicture}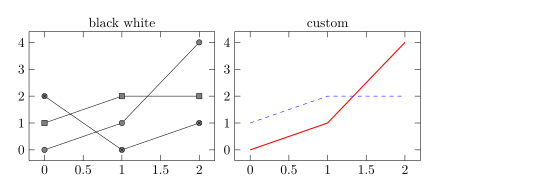
작동하는 내장 이름은 color(기본값), exotic, black white, mark list, linestyles입니다. 프리앰블의 \pgfplotscreateplotcyclelist{name}{...}는 다시 쓸 수 있는 목록을 정의합니다.
매끄러운 곡선과 계단
smooth는 직선 구간 대신 점들을 지나는 곡선을 그리며, tension(기본값 0.55)으로 얼마나 둥글지를 조절합니다. const plot은 다음 점까지 각 값을 유지하는 계단 함수를 그립니다.
smooth와 const plot
\begin{tikzpicture}
  \begin{axis}[ymin=0, legend pos=north west]
    \addplot+[smooth] coordinates {(0,1) (1,2.5) (2,1.8) (3,3.2) (4,2.4)};
    \addplot+[const plot] coordinates {(0,0.5) (1,1) (2,1.5) (3,1.2) (4,2)};
    \legend{smooth, const plot}
  \end{axis}
\end{tikzpicture}
도와 라디안으로 쓴 함수
수식은 pgfmath를 씁니다. + - * / ^, 괄호, sqrt, exp, ln, abs, min, max, sin, cos, tan 등을 쓸 수 있고, 상수로 pi와 e가 있습니다. 각도는 도 단위이므로 라디안은 deg(x)로 변환하세요.
한 주기의 sin과 cos
\begin{tikzpicture}
  \begin{axis}[domain=0:2*pi, samples=80, xlabel=$t$,
               xtick={0,1.5708,3.1416,4.7124,6.2832},
               xticklabels={$0$,$\frac{\pi}{2}$,$\pi$,$\frac{3\pi}{2}$,$2\pi$},
               legend pos=south west]
    \addplot[blue, thick] {sin(deg(x))};
    \addplot[red, thick, dashed] {cos(deg(x))};
    \legend{$\sin t$, $\cos t$}
  \end{axis}
\end{tikzpicture}
매개변수 곡선
x(t)와 y(t)로 주어진 곡선을 그리려면 두 수식을 괄호 안에 쉼표로 구분해 쓰고 variable=t를 지정하세요.
리사주 곡선
\begin{tikzpicture}
  \begin{axis}[axis lines=middle, xmin=-1.3, xmax=1.3, ymin=-1.3, ymax=1.3]
    \addplot[purple, thick, domain=0:360, samples=120, variable=t]
      ({cos(t)}, {sin(2*t)});
  \end{axis}
\end{tikzpicture}
곡선의 끊김
1/x 같은 함수는 무한대로 치솟습니다. restrict y to domain은 범위 밖의 점을 버리고, unbounded coords=jump는 두 갈래를 잇는 대신 그 지점에서 선을 끊습니다. 둘 다 \addplot에 넣으세요.
0에서 끊기는 1/x
\begin{tikzpicture}
  \begin{axis}[ymin=-10, ymax=10, axis lines=middle]
    \addplot[blue, thick, domain=-3:3, samples=200,
             restrict y to domain=-10:10, unbounded coords=jump] {1/x};
  \end{axis}
\end{tikzpicture}
TeX 설치 환경과 다른 점
CTAN의 pgfplots 설명서에 모든 옵션이 설명되어 있습니다: ctan.org/pkg/pgfplots. 선 없이 점만 그리려면 산점도를 보세요.
pgfplots 기초, 로그 축, 그룹 그래프, CSV 데이터도 함께 보세요.
질문과 답변
LaTeX에서 함수 그래프는 어떻게 그리나요?
axis 안에 \addplot[domain=a:b, samples=n] {formula};를 쓰고, 변수로 x를 써서 {x^2 - 1}처럼 수식을 적으세요.
선에서 마커를 없애려면 어떻게 하나요?
\addplot 옵션에 no marks를 넣거나, + 없이 옵션을 주세요(예: \addplot[blue]). 그러면 마커 없는 선이 그려집니다.
sin(x)가 왜 거의 평평하게 보이나요?
pgfplots는 각도를 도 단위로 읽으므로, 0에서 6까지의 sin(x)는 6도만 다룹니다. sin(deg(x))로 쓰세요.
이 페이지의 모든 예제는 사이트를 빌드할 때 Scissor LaTeX로 조판됩니다. 마지막 업데이트: 2026-11-07