


pgfplots ने लाइन प्लॉट
axis मध्ये प्रत्येक रेषेसाठी एक \addplot जोडा; प्रत्येकीला red, dashed, thick किंवा mark=square* सारख्या पर्यायांनी शैली द्या, किंवा cycle list ला तुमच्यासाठी शैली निवडू द्या.
एका अक्षात अनेक रेषा
प्रत्येक \addplot एक मालिका जोडतो. पर्यायांशिवाय मालिका त्यांची शैली cycle list मधून क्रमाने घेतात. \addplot+[...] ने तुम्ही ती शैली ठेवता आणि तिचा एक भाग बदलता.
डीफॉल्ट cycle list मधील तीन मालिका
\begin{tikzpicture}
  \begin{axis}[xlabel=Week, ylabel=Orders, legend pos=north west]
    \addplot coordinates {(1,12) (2,18) (3,25) (4,31) (5,44)};
    \addplot coordinates {(1,10) (2,14) (3,15) (4,21) (5,24)};
    \addplot+[dashed] coordinates {(1,5) (2,9) (3,8) (4,12) (5,13)};
    \legend{Erika, Hans, John}
  \end{axis}
\end{tikzpicture}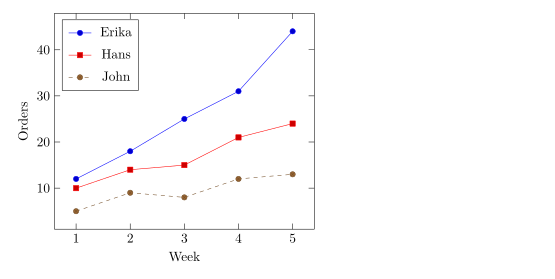
रेषांच्या शैली आणि मार्क्स
\addplot नंतरचे पर्याय रंग, रेषा आणि मार्क्स ठरवतात. तुम्ही ते मुक्तपणे एकत्र करू शकता.
| पर्याय | मूल्ये | Scissor LaTeX मध्ये |
|---|---|---|
| रंग | red, blue!60!black, color=teal, कोणतेही xcolor नाव किंवा मिश्रण | चालते |
| रेषेची जाडी | ultra thin, very thin, thin, semithick, thick, very thick, ultra thick, line width=1.5pt | चालते |
| डॅश नमुना | solid, dashed, dotted, densely dashed, loosely dotted, dashdotted, dash pattern=on 4pt off 2pt | चालते |
mark= | *, o, square*, square, triangle*, triangle, diamond*, diamond, x, +, star, pentagon*, asterisk, otimes*, |, -, none | चालते |
mark size=3pt | मार्कची त्रिज्या | चालते |
mark options={fill=white} | फक्त मार्क्सची शैली | चालते |
mark repeat=2 | प्रत्येक दुसऱ्या पॉइंटवर मार्क | चालते |
no marks, only marks | फक्त रेषा, फक्त मार्क्स | चालते |
रंग, डॅश नमुने आणि मार्क्स
\begin{tikzpicture}
  \begin{axis}[domain=0:4, samples=9, legend pos=outer north east]
    \addplot[blue, thick, mark=*] {x};
    \addplot[red, dashed, mark=square*, mark options={fill=white}] {x^1.5/2};
    \addplot[teal, densely dotted, very thick] {sqrt(x)};
    \addplot[orange, mark=triangle*, mark size=3pt, only marks] {4 - x};
    \legend{linear, power, root, falling}
  \end{axis}
\end{tikzpicture}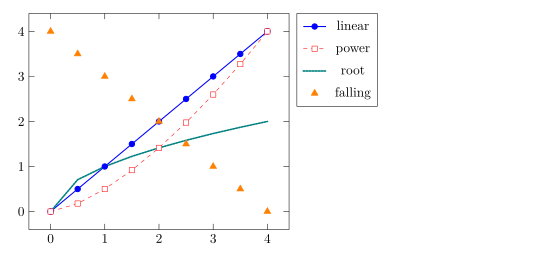
pgfplots प्रमाणेच, डॅश असलेल्या मालिकेवरही मार्क्स नेहमी सलग रेषांनी काढले जातात.
cycle list निवडणे
cycle list म्हणजे साध्या \addplot कमांड्स वापरत असलेल्या शैलींचा क्रम. cycle list name ने अंगभूत यादी निवडा, किंवा cycle list ने स्वतःची लिहा.
black white cycle list, आणि एक स्वतःची
\begin{tikzpicture}
  \begin{axis}[cycle list name=black white, width=6.5cm, height=5cm, title={black white}]
    \addplot coordinates {(0,0) (1,1) (2,4)};
    \addplot coordinates {(0,1) (1,2) (2,2)};
    \addplot coordinates {(0,2) (1,0) (2,1)};
  \end{axis}
\end{tikzpicture}
\begin{tikzpicture}
  \begin{axis}[cycle list={{red, thick}, {blue, dashed}}, width=6.5cm, height=5cm, title={custom}]
    \addplot coordinates {(0,0) (1,1) (2,4)};
    \addplot coordinates {(0,1) (1,2) (2,2)};
  \end{axis}
\end{tikzpicture}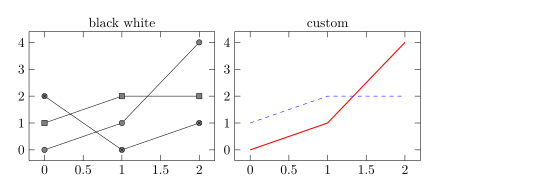
चालणारी अंगभूत नावे: color (डीफॉल्ट), exotic, black white, mark list आणि linestyles. preamble मधील \pgfplotscreateplotcyclelist{name}{...} पुन्हा वापरता येणारी यादी परिभाषित करतो.
गुळगुळीत वक्र आणि पायऱ्या
smooth सरळ तुकड्यांऐवजी पॉइंट्समधून वक्र काढतो; tension (डीफॉल्ट 0.55) तो किती गोलाकार आहे हे ठरवतो. const plot स्टेप फंक्शन काढतो जे प्रत्येक मूल्य पुढील पॉइंटपर्यंत धरून ठेवते.
smooth आणि const plot
\begin{tikzpicture}
  \begin{axis}[ymin=0, legend pos=north west]
    \addplot+[smooth] coordinates {(0,1) (1,2.5) (2,1.8) (3,3.2) (4,2.4)};
    \addplot+[const plot] coordinates {(0,0.5) (1,1) (2,1.5) (3,1.2) (4,2)};
    \legend{smooth, const plot}
  \end{axis}
\end{tikzpicture}
अंश आणि रेडियन्समधील फंक्शन्स
सूत्रे pgfmath वापरतात: + - * / ^, कंस, sqrt, exp, ln, abs, min, max, sin, cos, tan आणि इतर, pi आणि e स्थिरांकांसह. कोन अंशांमध्ये असतात, म्हणून रेडियन्स deg(x) ने रूपांतरित करा.
एका आवर्तनावर sin आणि cos
\begin{tikzpicture}
  \begin{axis}[domain=0:2*pi, samples=80, xlabel=$t$,
               xtick={0,1.5708,3.1416,4.7124,6.2832},
               xticklabels={$0$,$\frac{\pi}{2}$,$\pi$,$\frac{3\pi}{2}$,$2\pi$},
               legend pos=south west]
    \addplot[blue, thick] {sin(deg(x))};
    \addplot[red, thick, dashed] {cos(deg(x))};
    \legend{$\sin t$, $\cos t$}
  \end{axis}
\end{tikzpicture}
पॅरामेट्रिक वक्र
x(t) आणि y(t) ने दिलेला वक्र प्लॉट करण्यासाठी, दोन्ही सूत्रे कंसात स्वल्पविरामाने वेगळी करून लिहा, आणि variable=t ठरवा.
लिसाजू वक्र
\begin{tikzpicture}
  \begin{axis}[axis lines=middle, xmin=-1.3, xmax=1.3, ymin=-1.3, ymax=1.3]
    \addplot[purple, thick, domain=0:360, samples=120, variable=t]
      ({cos(t)}, {sin(2*t)});
  \end{axis}
\end{tikzpicture}
वक्रातील खंड
1/x सारखे फंक्शन अनंताकडे झेपावते. restrict y to domain रेंजबाहेरचे पॉइंट्स वगळतो, आणि unbounded coords=jump दोन शाखा जोडण्याऐवजी तिथे रेषा तोडतो. दोन्ही \addplot वर ठेवा.
शून्यावर खंड असलेले 1/x
\begin{tikzpicture}
  \begin{axis}[ymin=-10, ymax=10, axis lines=middle]
    \addplot[blue, thick, domain=-3:3, samples=200,
             restrict y to domain=-10:10, unbounded coords=jump] {1/x};
  \end{axis}
\end{tikzpicture}
TeX इन्स्टॉलेशनपेक्षा काय वेगळे आहे
CTAN वरील pgfplots पुस्तिका प्रत्येक पर्यायाचे वर्णन करते: ctan.org/pkg/pgfplots. रेषांशिवाय पॉइंट्ससाठी स्कॅटर प्लॉट पाहा.
हेही पाहा: pgfplots च्या मूलभूत गोष्टी, लॉगरिदमिक अक्ष, ग्रुप प्लॉट आणि CSV मधील डेटा.
प्रश्न आणि उत्तरे
LaTeX मध्ये फंक्शन कसे प्लॉट करायचे?
axis मध्ये \addplot[domain=a:b, samples=n] {formula}; लिहा, चल म्हणून x वापरून, उदाहरणार्थ {x^2 - 1}.
रेषेवरून मार्क्स कसे काढायचे?
\addplot च्या पर्यायांमध्ये no marks जोडा, किंवा + शिवाय पर्याय द्या (उदाहरणार्थ \addplot[blue]), जे साधी रेषा काढते.
sin(x) जवळपास सपाट का दिसतो?
pgfplots कोन अंशांमध्ये वाचते, म्हणून 0 ते 6 वरील sin(x) फक्त 6 अंश व्यापतो. sin(deg(x)) लिहा.
या पेजवरील प्रत्येक उदाहरण साइट तयार होताना Scissor LaTeX टाइपसेट करते. शेवटचे अपडेट: 2026-11-07.